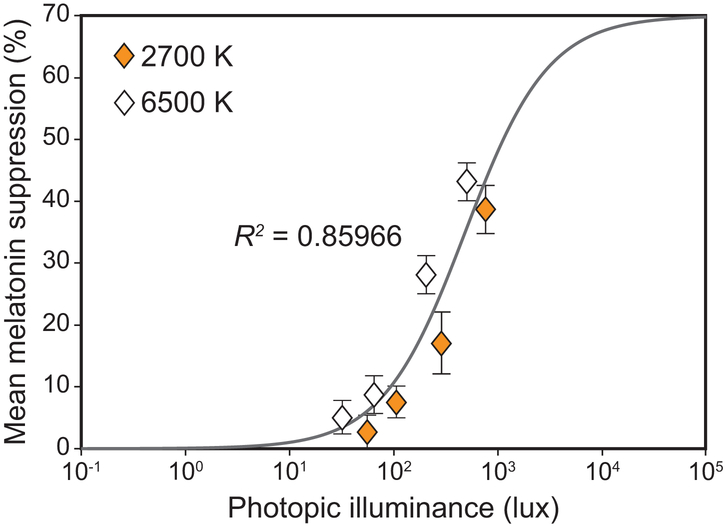
Figure 7.
Logistic best-fit (R2 = 0.86) to the melatonin suppression data further plotted as a function of photopic illuminance levels, which is a widely used metric to characterize many human visual responses. For each target CS level, the higher photopic light levels for the 2700 K source consistently resulted in lower melatonin suppression compared to the circadian stimulus matched 6500 K source providing lower photopic light levels. The error bars represent SEM.

