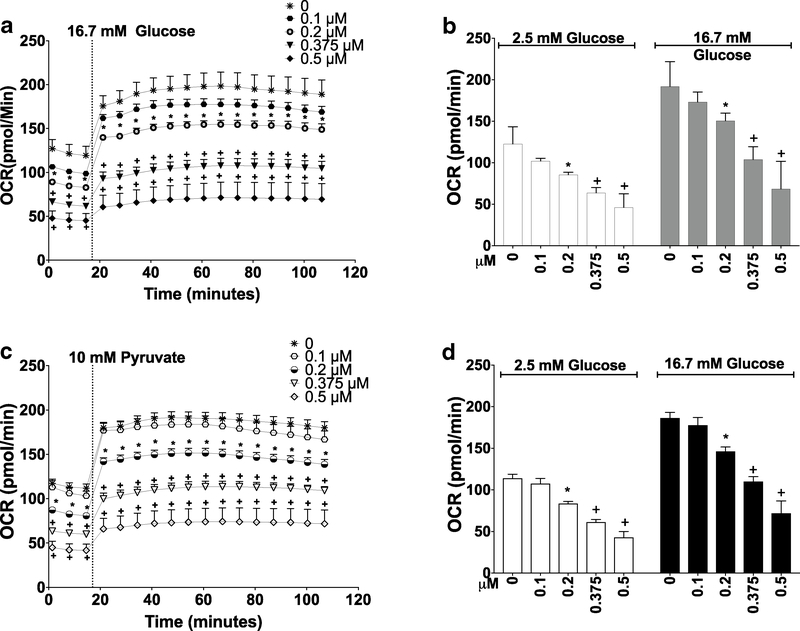
Fig. 3.
Oxygen consumption in INS-1 832/13 cells after 24-h exposures to MAsIII. OCR was measured in INS-1 832/13 cells stimulated with 16.7 mM glucose (a, b) or 10 mM pyruvate (c, d) following 24-h exposure to MAsIII. a, c Additions of 16.7 mM glucose or 10 mM pyruvate are marked by dotted lines. b, d: OCR values recorded at low glucose (2.5 mM), high glucose (16.7 mM), and pyruvate (10 mM) were averaged to quantify the overall effects of the exposure. Mean + SEM is shown for four biological replicates. *p < 0.05, +p < 0.01 for comparison of treated versus untreated (0 μM) cells

