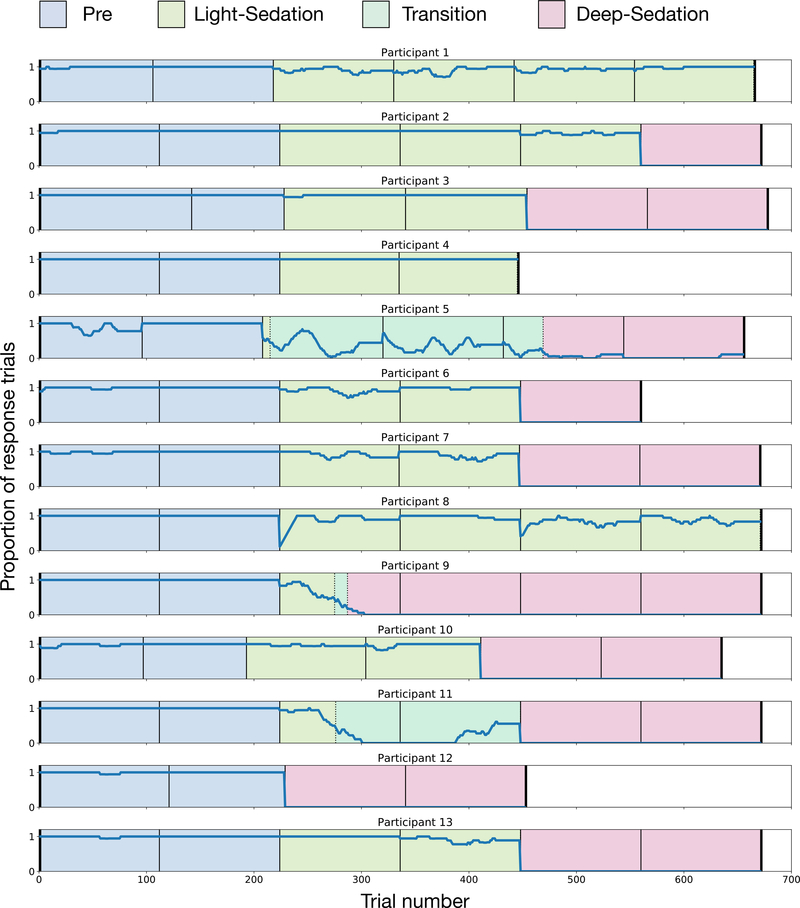
Figure 1.
Moving window (20 trials) of proportion of responses in each participant, along with sedation classifications assigned to the data. Black lines denote functional magnetic resonance imaging run breaks. Blue shading = Pre; green shading = Light-Sedation; teal shading = transitional (not analyzed); red shading = Deep-Sedation.

