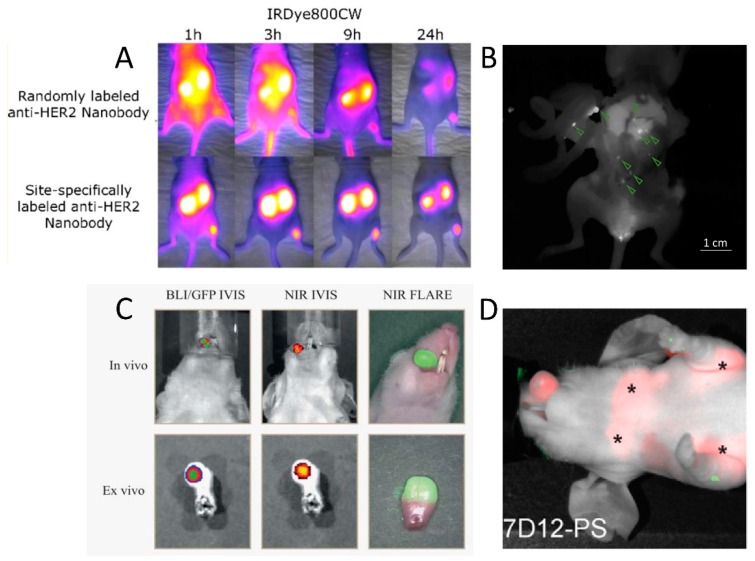
Figure 2.
Examples of in vivo fluorescent molecular imaging with nanobody tracers in mouse tumor models. (A) Comparison of the biodistribution and tumor-targeting potential of the anti-HER2 nanobody 2Rs15d conjugated with IRDye800CW either randomly (top) or site-specifically (bottom). Adapted with permission from [111]. Copyright 2017 American Chemical Society. (B) Fluorescence image acquired during the surgical resection of intraperitoneally disseminated HER2+ tumor lesions. Site-specifically IRDye800CW-labeled 2Rs15d nanobody was injected 90 min before surgery. Fluorescent signal in tumor lesions (indicated by green arrows) is clearly discernible from background signal. Adapted with permission from [123]. (C) Real-time fluorescence imaging of orthotopic tongue tumor 24 h post-injection of an EGFR-specific randomly IRDye800CW-conjugated nanobody. Colocalization with bioluminescence imaging (BLI) and green fluorescent protein (GFP) signals is shown. Adapted with permission from [109]. (D) Fluorescent imaging of an orthotopically inoculated tongue tumor at 1 h post-injection of an EGFR-specific randomly IRDye700DX-conjugated nanobody for photodynamic therapy (PDT). Stars denote the presence of fluorescent tracer uptake in invaded lymph nodes. Adapted with permission from [125].

