Figure 3.
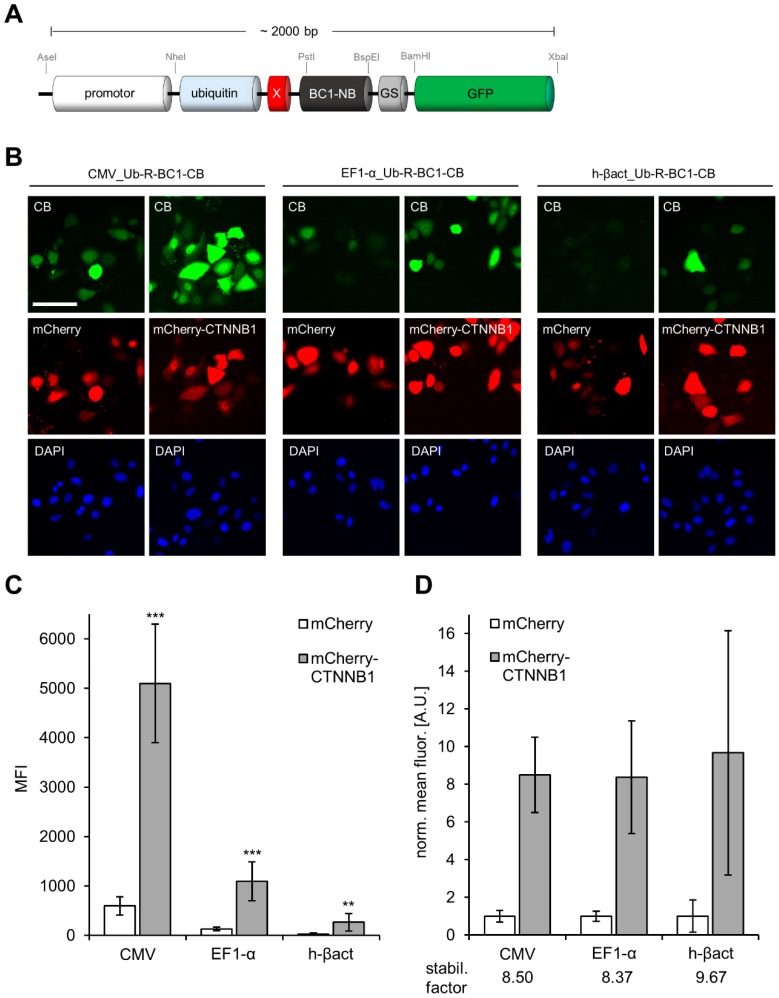
Quantitative image analysis of promoter-driven Ub-R-BC1-eGFP expression. (A) Schematic illustration of the CB expression construct for promoter testing. Promoter sequences can easily be exchanged using unique indicated restriction sites (AseI, NheI). (B) Representative images of HeLa cells transiently expressing Ub-R-BC1-CB driven by different promoters (CMV, EF1-α and h-βact) in combination with either mCherry (control) or mCherry-CTNNB1 (antigen). Nuclei were stained with DAPI, scale bar: 50 µm. (C) Bar chart represents mean CB fluorescence intensity (MFI) detected by quantitative fluorescence imaging in either control (mCherry) or antigen (mCherry-CTNNB1) expressing cells (n = 3, >200 cells each). (D) For every promoter construct, MFI of the CB in antigen expressing cells was normalized to the respective CB-signal determined in cells co-expressing mCherry as control, leading to the indicated stabilization factors. Error bars: S.D. Statistical analysis was performed using student’s t-test, *** p < 0.001, ** p < 0.01.

