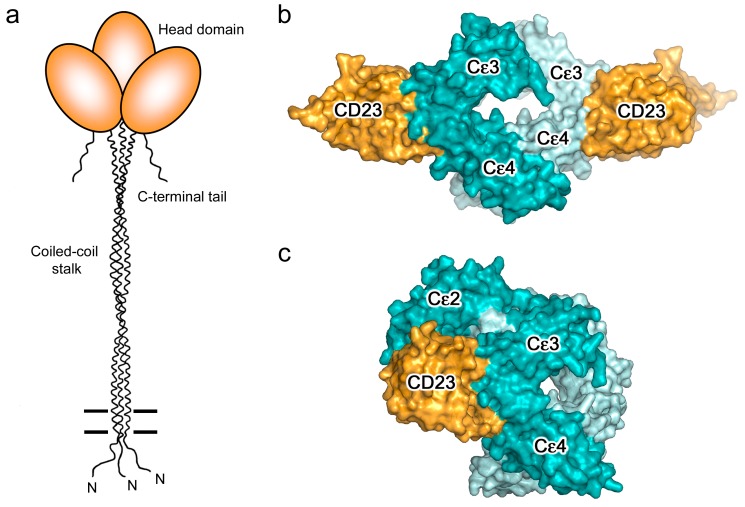
Figure 5.
CD23. (a) Schematic representation of CD23: the three identical chains showing the triple α-helical coiled-coil “stalk”, C-type lectin-like IgE-binding “head” domains, and C-terminal “tails”. Figure adapted by permission from John Wiley & Sons, Inc. (Sutton, B.J.; Davies, A.M. Structure and dynamics of IgE-receptor interactions: FcεRI and CD23/FcεRII. Immunol. Rev. 2015, 268, 222–235 [6]). (b) The 2:1 complex between sCD23 (orange) and Fcε3-4 [51]. (c) The 1:1 complex between sCD23 (orange) and IgE-Fc, in which IgE-Fc adopts an acutely bent conformation [53]. In panels (b,c), IgE-Fc chains A and B are coloured dark cyan and pale cyan, respectively.

