Abstract
Titanium silicalite-1 (TS-1) with little extraframework Ti was hydrothermally synthesized in a tetrapropylammonium hydroxide system using starch as the additive. The influences of the amount of starch added on the coordination states of titanium ions and the functional mechanism of starch were studied by various characterization means. The addition of starch slowed the crystallization rate of TS-1 so that the insertion rate of titanium to the framework matched well with that of silicon. Therefore, the generation of extraframework Ti, including the anatase TiO2 and octahedrally coordinated titanium, was eliminated. The catalytic performances of the TS-1 samples were evaluated in the epoxidation of 1-butene to produce butene oxide. The catalytic activity of TS-1 was improved significantly due to the increasing amount of framework Ti.
1. Introduction
Titanium silicalite-1 (TS-1) with MFI topology was first hydrothermally synthesized in 1983 by Taramasso et al.1 The titanium ions substitute isomorphously a small fraction of silicon ions in the tetrahedrally coordinated sites in the silicalite-1 framework, leading to some unique properties, such as a high hydrophobicity and excellent catalytic performance for the selective oxidation reactions. Over the past 3 decades, TS-1 has attracted much attention, and has been widely studied, due to its excellent catalytic performances in the epoxidation of alkenes,2−5 hydroxylation of aromatics,6−8 oxidation of alkanes,9,10 ammoximation of ketones,11−13 and oxidative desulfurization.14−17 The catalytic activity of TS-1 was primarily attributed to the tetrahedrally coordinated Ti, which is called framework Ti.2 A higher framework Ti content usually has a higher catalytic activity. However, the content of framework Ti is usually less than 2.5 mol %,18 which is accounted for by the fact that the ionic diameter of Ti4+ is larger than that of Si4+, leading to the lattice expansion when titanium ions are inserted into the framework.19,20 The excessive Ti species in the synthesis system will be transformed to extraframework Ti, including anatase TiO2 and octahedrally coordinated Ti. The latter is taken as an inert component for the selective oxidation in TS-1;21 however, in recent years, some researchers have tried to prove that it is more active than tetrahedrally coordinated Ti.22−24 It was reported that anatase TiO2 was the catalyst for the inefficient decomposition of H2O2 and could cover the active centers in TS-1,25 which would be harmful to the catalytic oxidation. Thus, the generation of anatase TiO2 should be restrained.
Nevertheless, increasing the content of framework Ti and inhibiting the generation of extraframework Ti remain challenges for researchers. At present, one of the effective pathways is matching the crystallization rates of titanium and silicon sources. The crystallization rate of titanium was reported to be higher than that of silicon;26 thus, reducing the rate of titanium or accelerating that of silicon both benefited the incorporation of titanium into the framework. Prasad et al.27 introduced microwave heating into the synthesis procedure for TS-1. The crystallization time of the silicon source was shortened obviously. Therefore, more Ti ions were inserted into the framework, and less extraframework Ti was generated by this means. Huang et al.28 found that ethanol could suppress the formation of extraframework Ti on addition to the TS-1 synthesis gel after the evaporation of alcohol. Other researchers also reported that the temperatures of evaporation and crystallization had a crucial effect on the coordination states of the titanium ions.29−31 Fan et al.32 used different ammonium salts as crystallization-mediating agents to synthesize TS-1. They found that the ammonium salts could not only drastically decrease the pH of the synthesis gel and slow the crystallization process but also modify the crystallization mechanism and make the incorporation of titanium into the framework match well with that of silicon. As a result, the formation of extraframework Ti was successfully eliminated. However, the content of framework Ti was also reduced.33 Wang et al.10 proposed a strategy to eliminate extraframework Ti, based on the combination of liquid-phase and solid-phase transformation mechanisms. The anionic polyelectrolyte, poly(acrylic acid), was used as the gelating agent to prepare the solid/liquid mixture, which could partly convert the liquid-phase precursor to the solid-phase precursor. Framework Ti was formed by in situ conversion of the Ti species from the solid-phase precursor during the crystallization stage, as well as by the transfer of Ti species from the liquid-phase precursor to the solid crystal after the crystallization. Some researchers have reported that sucrose would be carbonized during the crystallization of TS-1 and release hydrogen ions.34 Therefore, the pH of the hydrothermal system was reduced, and the sucrose played a similar role to that of the ammonium salts.
Starch is a kind of polysaccharide, which has been used to synthesize hierarchical zeolites.35 Because of the micelles formed by starch, some mesopores are generated in the zeolites with an MFI topology. However, the mesopores are primarily attributed to the irregular intercrystal spaces. Furthermore, the effect of starch on the coordination states of Ti has not been mentioned.
In the present article, starch was introduced into the synthesis gel to assist in obtaining TS-1 with a little extraframework Ti. The influence of the amount of starch on the TS-1 properties was studied systematically. The functional mechanism of starch was discussed accordingly. Compared to the TS-1 synthesized without starch, that obtained using this method has a high content of framework Ti and quite a low content of extraframework Ti. Therefore, it had a much higher catalytic activity for the epoxidation of 1-butene.
2. Results and Discussion
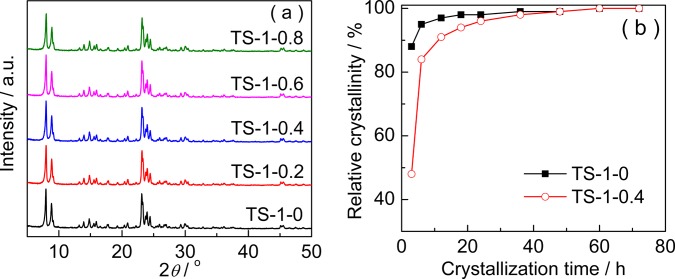
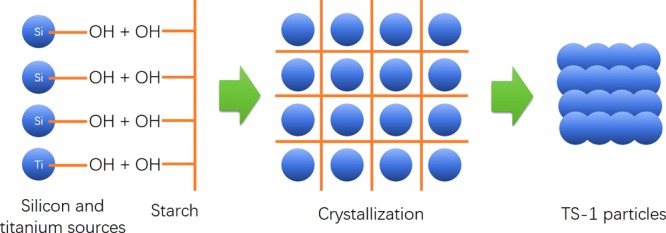
Figure 1 shows the X-ray diffraction (XRD) patterns (a) and crystallization curves (b) of the TS-1 obtained with different amounts of starch. All of the samples have five characteristic diffraction peaks of the MFI topology, which are sited at 2θ values of 7.9, 8.8, 23.0, 23.9, and 24.4°,36 indicating that the addition of starch does not change the topology of the zeolite. Furthermore, the relative crystallinities, which were calculated by comparing the total intensities of the three characteristic peaks in the 2θ range of 23–25°, are similar in the five samples. This demonstrates that the crystallization of TS-1 can be completed under these synthesis conditions. To investigate the effects of starch on the crystallization process, we compared the crystallization curve (relative crystallinity vs crystallization time) of TS-1-0 to that of TS-1-0.4 (Figure 1b). It is clear that the relative crystallinity of TS-1-0.4 is lower than that of TS-1-0 when the crystallization time is shorter than 48 h, suggesting that the crystallization rate of the former is lower than that of the latter. In other words, the crystallization slowed when starch was introduced during the synthesis process. Starch will generate a netlike structure in the aqueous solution. This structure can separate the silicon and titanium sources into small parts in the synthesis gel and hinder the combination of the two sources. This may be one of the reasons for the lowering of crystallization rate. On the other hand, some starch will be carbonized during the hydrothermal process, releasing some hydrogen cations and reducing the pH of the synthesis gel. The lower pH will also lead to a lower crystallization rate, which may be beneficial to the insertion of more titanium into the MFI framework due to the better-matched insertion rates of silicon compared to those of titanium.32,34
Figure 1.
XRD patterns (a) and crystallization curves (b) of TS-1 synthesized with different amounts of starch.
Table 1 lists the pH’s of the synthesis gels before crystallization and those of the mother liquors after crystallization. The pH of the gels on adding starch is slightly lower than that without the addition of starch, but they are similar. After crystallization for 72 h, the pH of each obtained mother liquor is lower than that before crystallization. However, the extents of decrease in the pH are distinct. Addition of a higher amount of starch leads to a lower pH of the mother liquor. This is due to the decomposition and carbonization of starch, releasing H+ during the crystallization process. More starch can release more H+ and thus cause a lower pH.
Table 1. Physicochemical Properties of the TS-1 Synthesized with Different Amounts of Starch, and the pH of the Synthesis Gel.
| cat. | I960/800a | I695/800b | I144/380c | SiO2 (wt %) | TiO2 (wt %) | n(Si/Ti)d | pH1e | pH2 |
|---|---|---|---|---|---|---|---|---|
| TS-1-0 | 1.56 | 0.97 | 1.11 | 95.9 | 4.1 | 31.3 | 12.78 | 12.50 |
| TS-1-0.2 | 1.89 | 0.80 | 1.50 | 96.7 | 3.3 | 39.8 | 11.76 | 11.36 |
| TS-1-0.4 | 2.06 | 0.32 | 0.00 | 96.9 | 3.1 | 41.9 | 11.78 | 10.87 |
| TS-1-0.6 | 1.98 | 1.06 | 0.02 | 96.7 | 3.3 | 39.1 | 11.77 | 10.25 |
| TS-1-0.8 | 1.87 | 1.43 | 0.02 | 96.4 | 3.6 | 35.2 | 11.72 | 9.23 |
I960/800 denotes the relative intensity of the bands at 960 and 800 cm–1 in the FTIR spectra of the samples.
I695/800 denotes the relative intensity of the bands at 695 and 800 cm–1 in the UV–Raman spectra of the samples excited by a 266 nm laser line.
I144/380 denotes the relative intensity of the bands at 144 and 380 cm–1 in the UV–Raman spectra of the samples excited by a 325 nm laser line.
The elemental compositions are obtained by the inductively coupled plasma optical emission spectrometer (ICP-OES).
pH1 and pH2 represent the pH of the synthesis gel before crystallization and that of the mother liquor after the crystallization, respectively.
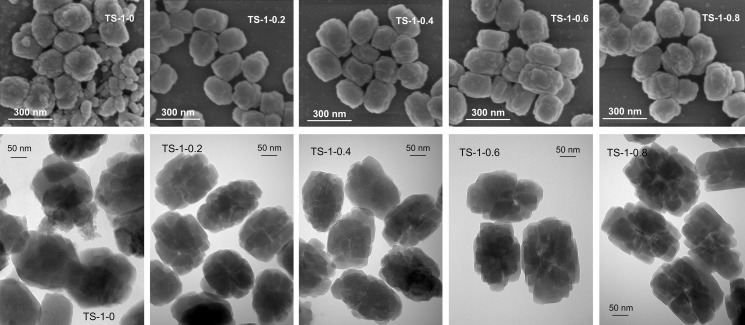
SEM and TEM images of TS-1 synthesized with different amounts of starch are illustrated in Figure 2. From the SEM images of the samples, it can be seen that the morphology of TS-1-0 is not uniform and the particle size distribution is wide (from 50 to 250 nm). However, all samples synthesized with the addition of starch show an approximately spheroidal morphology, with a particle size of ∼150 nm. This phenomenon may also be attributed to the netlike structure of starch, confining the growth of small TS-1 particles, accompanied by the separation of large amounts of silicon and titanium sources. The external surface of the particles seems quite tough because the particles are aggregates of small crystals, which can be observed from the TEM images. A tough surface may expose more active sites, and the intercrystal spaces may show a higher catalytic activity, which would benefit the catalytic selective oxidation reactions.
Figure 2.
SEM and TEM images of TS-1 synthesized with different amounts of starch.
FTIR spectra of TS-1 samples synthesized with different amounts of starch are shown in Figure 3. The bands at wavenumbers of 450 and 550 cm–1 are assigned to the Si–O bending mode and the stretching vibration of structural double five-membered ring, respectively.37−39 These two bands prove the formation of the MFI topology in all samples, which is consistent with the XRD results in Figure 1. There is usually an absorption band at 960 cm–1 in TS-1. The assignment of this band is controversial. Bordiga et al.40,41 thought that it belonged to the stretching vibration of the Si–O bond affected by the Ti ions in the neighborhood. However, it was also assigned to the Si–OH bond on the surface or the defects in the zeolites.42 Nevertheless, most researchers believe that the appearance of the band at 960 cm–1 can be considered as indirect proof for the introduction of titanium into the framework. It can be clearly seen from Figure 3 that all TS-1 samples show a band at 960 cm–1, suggesting the incorporation of Ti into the framework.
Figure 3.
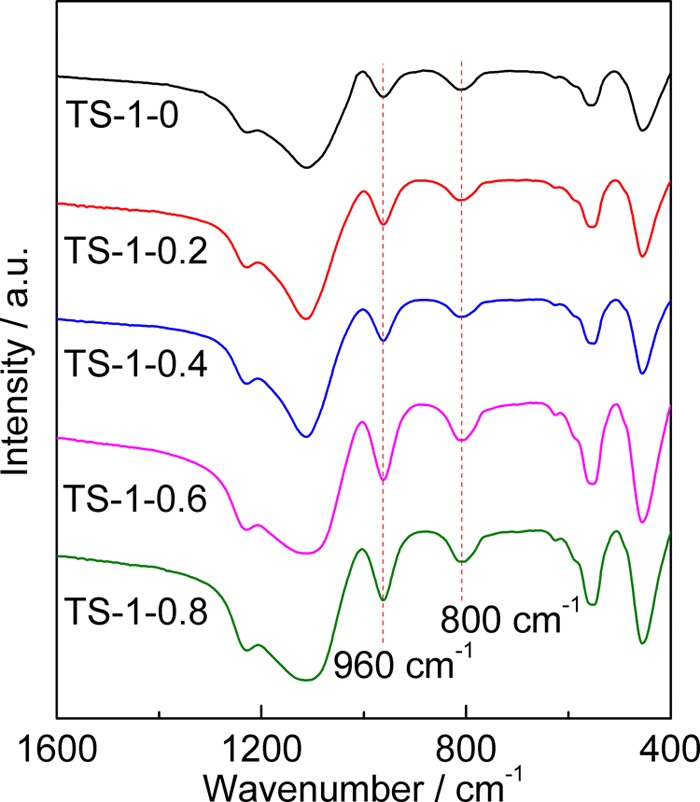
FTIR spectra of TS-1 synthesized with different amounts of starch.
In the FTIR spectroscopy, the relative intensities of the bands at 960 and 800 cm–1 (I960/800) are often used to compare the relative contents of framework titanium in different TS-1 samples.43 The I960/800 values of the TS-1 samples, which are listed in Table 1, increase with an increase in the amount of starch until m(St/SiO2) is 0.4, and then, the values decrease slightly, indicating that the framework Ti content increases first and then decreases. In other words, the effect of starch on the framework Ti content presents a volcano curve. Furthermore, the contents of framework Ti in the TS-1’s synthesized with starch are all higher than those in TS-1-0. The highest I960/800 is obtained for TS-1-0.4, demonstrating that the framework Ti content in TS-1-0.4 is the highest among all samples. Because the catalytic oxidation performance of TS-1 is closely related to the framework Ti content, TS-1-0.4 is expected to show excellent catalytic activity for the epoxidation of 1-butene.
Table 1 also lists the elemental compositions and n(Si/Ti) in TS-1 synthesized with different amounts of starch. The feeding n(Si/Ti) is 40. With an increase in the amount of starch added, the total content of Ti species in TS-1 decreases first and then increases; therefore, n(Si/Ti) increases first and then decreases. The total content of Ti is decided by the comprehensive function of the different coordinated Ti species. Therefore, it is necessary to study the effect of starch on the coordination states of titanium ions.
UV/vis spectroscopy is one of the first techniques used for detecting the coordination states of titanium ions in TS-1. There are mainly three sets of absorption bands in the UV/vis spectrum of TS-1. The band at ∼210 nm is due to the transition of the 2p electron of oxygen to the Ti4+ 3d orbit.44 This band suggests the existence of tetrahedrally coordinated Ti, which is also called framework Ti. The contribution of the wide band between 240 and 280 nm is controversial. Some researchers believed that it belonged to the octahedrally coordinated Ti formed by isolated [TiO4] or [HOTiO3] with two water molecules,45,46 but some thought it was caused by the condensation of hexahedrally coordinated Ti involving the Ti–O–Ti bond.47,48 After studying the contribution of the band, we found that there are at least two kinds of Ti species,33 one of which is the octahedrally coordinated Ti and another, the pentahedrally coordinated Ti with quite a high catalytic activity for selective oxidation. The band at 310–330 nm was attributed to anatase TiO2, the presence of which would lead to ineffective decomposition of H2O2.25 Therefore, the formation of anatase TiO2 should be restricted.
Figure 4 shows the UV/vis spectra of TS-1 synthesized with different amounts of starch. It is clear that the coordination states of the Ti ions in the samples are affected by variation of the amount of starch added to the synthesis gel, especially for extraframework Ti. An obvious absorption band at ∼330 nm appears in TS-1-0, proving the existence of anatase TiO2. However, the generation of anatase TiO2 was inhibited significantly by the addition of starch. The content of anatase TiO2 shows an opposite trend to that of framework Ti obtained from the FTIR spectra. It can also be seen that the content of octahedrally coordinated Ti in TS-1-0.8 increases slightly, probably due to the introduction of starch promoting the coordination saturation of titanium ions. The spectra of all of the TS-1 samples have a band at ∼210 nm, proving the existence of tetrahedrally coordinated Ti in all of the samples. However, the quantitative analysis of Ti with different coordination states by UV/vis is limited. Therefore, we adopted UV–Raman spectroscopy.
Figure 4.
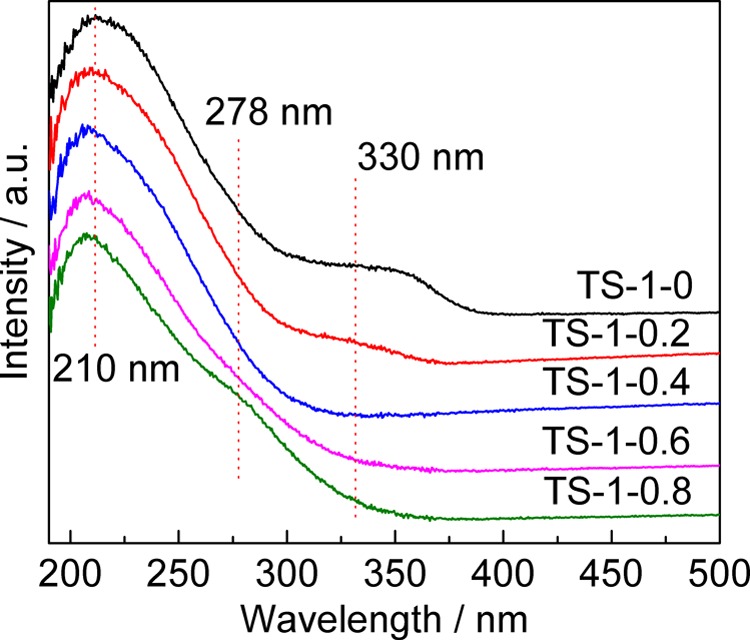
UV/vis spectra of TS-1 synthesized with different amounts of starch.
UV–Raman resonance spectroscopy was first reported by Li et al.49 Using a UV excitation laser can yield a stronger response and avoid fluorescence interference. Three sets of UV excitation lasers with different wavelengths (244, 266, and 325 nm) were used to examine the different coordination states of titanium ions.
Figure 5 shows the UV–Raman spectra of TS-1 samples synthesized with different amounts of starch, excited by a 244 nm laser line. Tetrahedrally coordinated framework titanium species were sensitive to this line. The strong absorption bands sited at 490, 530, and 1125 cm–1 were assigned to the bending, symmetric stretching, and asymmetric stretching vibrations of the Ti–O–Si species, respectively, which were the direct proof of the existence of framework titanium.50 This is in accordance with the results of UV/vis and FTIR spectra. All of the samples have an obvious absorption band at 800 cm–1, which is the characteristic absorption of the MFI topology. The intensities of the bands are similar, indicating that the relative crystallinities of the samples are nearly the same, which agrees with the XRD results.
Figure 5.
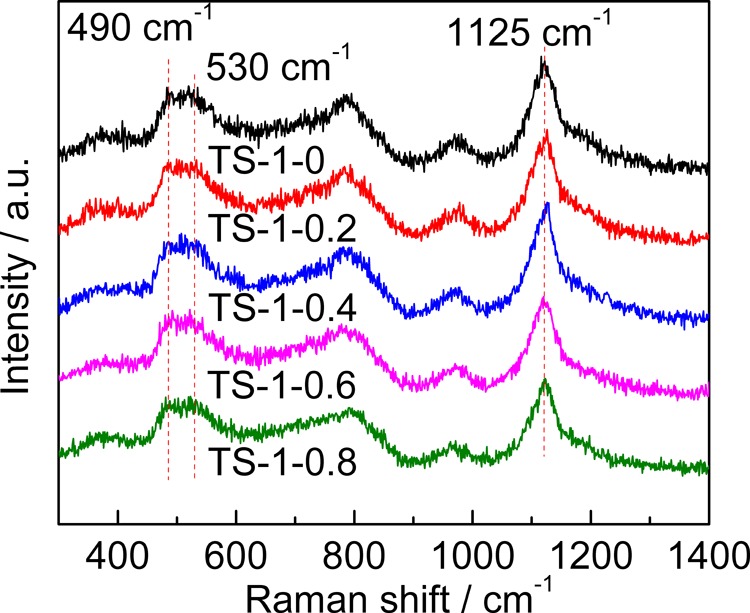
UV–Raman spectra of TS-1 synthesized with different amounts of starch. The wavelength of the excitation light is 244 nm.
UV–Raman spectra of TS-1 synthesized with different amounts of starch, excited by a 266 nm laser line, are shown in Figure 6. Octahedrally coordinated titanium species are sensitive to this line.51 In the spectra, the band sited at 695 cm–1 is assigned to the octahedrally coordinated titanium species, whereas that at 800 cm–1 is attributed to the MFI topology. The relative intensities of the bands at 695 and 800 cm–1 (I695/800) can be used for assessing the content of octahedrally coordinated Ti, the data for which are listed in Table 1. I695/800 decreases with an increase in the amount of starch added until m(St/SiO2) reaches 0.4, and then, it increases gradually. This indicates that the addition of starch can inhibit the generation of octahedrally coordinated titanium at a low content but can also promote its generation at a high content. This result coincides with that from the UV/vis spectra. The lowest content of octahedrally coordinated titanium is obtained for TS-1-0.4.
Figure 6.
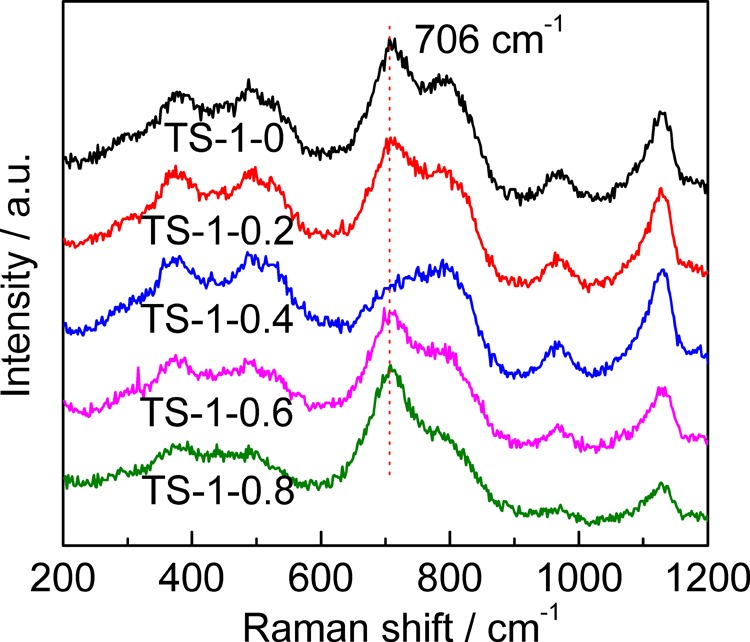
UV–Raman spectra of TS-1 synthesized with different amounts of starch. The wavelength of the excitation light is 266 nm.
Anatase TiO2 is sensitive to UV–Raman spectroscopy with an excitation wavelength of 325 nm. The bands sited at 144, 390, 516, and 637 cm–1 are attributed to anatase TiO2. From the UV–Raman spectra of TS-1 synthesized with different amounts of starch (Figure 7), we can see that a strong band at 144 cm–1 appears in the spectra of TS-1-0 and TS-1-0.2, indicating the existence of anatase TiO2 in the two samples. However, the characteristic bands of anatase TiO2 in the other samples are not clear. Thus, another relative intensity for the bands at 144 and 380 cm–1 (I144/380) was adopted (see Table 1). The band at 380 cm–1 is the characteristic band of the MFI topology, and I144/380 can yield the content of anatase TiO2.52 The results show that when m(St/SiO2) is higher than 0.4, the formation of anatase TiO2 is significantly inhibited.
Figure 7.
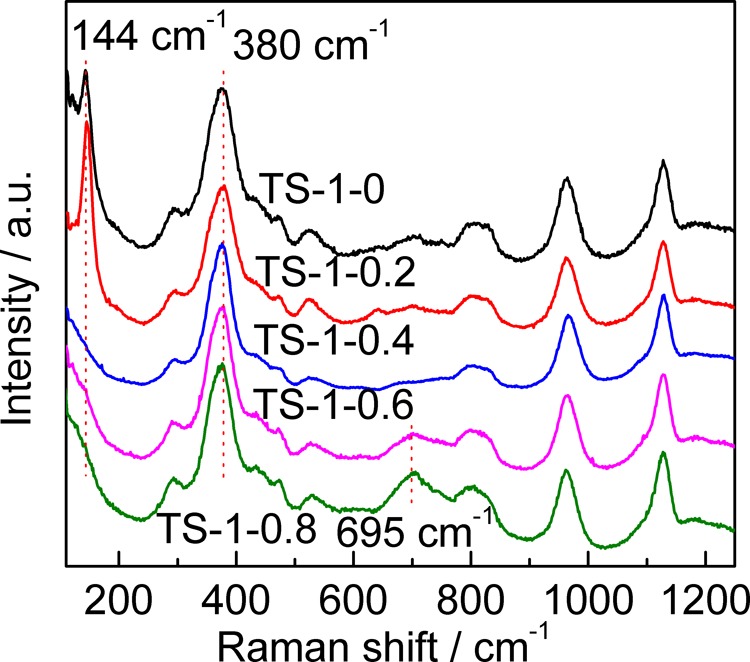
UV–Raman spectra of TS-1 synthesized with different amounts of starch. The wavelength of the excitation light is 325 nm.
The catalytic performances of the TS-1 samples synthesized with different amounts of starch were evaluated in the epoxidation of 1-butene (see Table 2). The conversions of H2O2 and turnover frequencies (TOFs) over the samples synthesized with starch are all higher than those over TS-1-0, indicating that the addition of starch is beneficial to catalytic selective oxidation. Furthermore, the two parameters reveal a similar trend to that of the content of tetrahedrally coordinated Ti, given by FTIR and UV–Raman spectroscopies. Although the total content of titanium in TS-1-0.4 is the lowest, the highest conversions of H2O2 and TOF are obtained over it because of the highest content of tetrahedrally coordinated Ti and lowest content of extraframework Ti. The TOFs of TS-1-0.6 and TS-1-0.8 are lower than those of TS-1-0.4, indicating that the catalytic activity of the octahedrally coordinated Ti is absolutely lower than that of the tetrahedral one. The selectivity of butene oxide (BO) decreases with an increment in the content of octahedrally coordinated Ti. It was reported that this Ti species could promote the solvolysis of propene oxide in the epoxidation of propene.22 The utilization of H2O2 over TS-1 with an m(St/SiO2) of no less than 0.4 is obviously higher than that of the other samples, mainly due to the elimination of anatase TiO2 in the former. In summary, the coordination state of Ti plays a more important role in the catalytic performance than does the content of titanium.
Table 2. Catalytic Performances of 1-Butene Epoxidation over TS-1 Synthesized with Different Amounts of Starcha.
| cat. | X(H2O2) (%) | S(BO) (%) | U(H2O2) (%) | TOF (mol H2O2 mol Ti–1h–1) |
|---|---|---|---|---|
| TS-1-0 | 60.5 | 97.9 | 93.6 | 401.4 |
| TS-1-0.2 | 66.6 | 98.6 | 94.0 | 548.9 |
| TS-1-0.4 | 72.7 | 98.2 | 99.8 | 637.9 |
| TS-1-0.6 | 68.5 | 97.8 | 99.9 | 564.6 |
| TS-1-0.8 | 68.0 | 98.4 | 99.4 | 513.8 |
Reaction conditions: cat 0.1 g; concentration of H2O2 1.0 mol L–1; methanol as the solvent; pressure of 1-butene, 0.25 MPa; 323 K; 1 h.
3. Experimental Section
3.1. Synthesis of TS-1
The TS-1 samples were synthesized in a tetrapropylammonium hydroxide (TPAOH) hydrothermal system using tetraethyl orthosilicate (TEOS) and tetrabutyl titanate (TBOT) as silicon and titanium sources, respectively. The TEOS and TBOT were hydrolyzed separately with TPAOH solution according to the method described by Wang et al.53 Then, the hydrolysates were mixed in a flask and heated at 363 K for 40 min to remove the alcohols. The molar composition of the gel was as follows: n(SiO2)–n(TiO2)–n(TPAOH)−n(H2O) = 1:0.025:0.3:37. Powdered starch was dissolved in distilled water to generate a starch sol (5 wt %). Different amounts of starch sol were added to the above synthesis gel and stirred for 10 min before it was transferred to a Teflon-lined autoclave. The weight ratio of starch to silica in the synthesis precursor (m(St/SiO2)) varied from 0 to 0.8. The precursor was crystallized at 443 K for 72 h, and a white suspension was obtained. The solid was separated from the suspension by centrifugation, dried at 373 K for 10 h, and calcined at 833 K for 6 h. The TS-1 samples obtained are denoted TS-1-x, where x stands for m(St/SiO2). For instance, TS-1-0.3 is TS-1 synthesized by adding starch with an m(St/SiO2) of 0.3.
3.2. Characterization of TS-1
X-ray powder diffraction (XRD) patterns were recorded on a Rigaku Corporation SmartLab 9 X-ray diffractometer using Cu Kα radiation. UV/vis diffused reflectance spectra were recorded on a Jasco UV-550 spectrometer from 500 to 190 nm. Pure BaSO4 was adopted as a reference. Fourier transform infrared (FTIR) spectra were determined on a Bruker EQUINOX55 spectrometer from 4000 to 400 cm–1, and the KBr pellet technique was used. The catalysts were viewed under a FEI QUANTA 450 scanning electron microscope (SEM) and a Tecnai G220 S-Twin transmission electron microscope. Ultraviolet resonance Raman (UV–Raman) spectra were obtained on a DL-1 UV–Raman spectrometer (Dalian Institute of Chemical Physics). The continuous-wave UV laser sources are from a Coherent Innova 300 Fred cw UV laser equipped with an intracavity frequency-doubling system, using a β-barium borate crystal to produce second harmonic generation outputs at different wavelengths of 244, 266, and 325 nm. A spectrograph system was set up with a UV-sensitive charge-coupled device (Spex) and a triplemate (1877D; Jobin Yvon-Spex). The elemental composition was obtained on a PerkinElmer OPTIMA 2000DV ICP-OES. The molar ratio of silicon to titanium (n(Si/Ti)) was calculated according to the data from the ICP-OES.
3.3. Epoxidation of 1-Butene
Epoxidation of 1-butene was carried out in a stainless steel batch reactor (200 mL). The evaluation process involved feeding the synthesized TS-1 (0.1 g) and H2O2/methanol solution (1.0 mol L–1, 34 mL) into the reactor and sealing the reactor. 1-Butene was then charged into the reactor at a pressure of 0.25 MPa. After heating the substrates at 323 K for 1 h under magnetic stirring, the reactor was cooled and the product was taken out. The residual H2O2 in the product was measured by iodometric titration. The organic products were analyzed by a Tianmei 7890F gas chromatograph equipped with a flame ionization detector and a capillary column (PEG-20M, 30 m × 0.25 mm × 0.5 μm). The main product is BO, and the byproducts are monomethyl ethers (MME) of BO and butanediol (BD). The conversion of H2O2 (X(H2O2)), selectivity of BO (S(BO)), utilization of H2O2 (U(H2O2)), and TOF were calculated according to eqs 1–4, respectively, as follows
| 1 |
| 2 |
| 3 |
| 4 |
where n0(H2O2) and n(H2O2) represent the initial and final molar numbers of H2O2, respectively; n(BO), n(MME), and n(BD) represent the molar numbers of BO, MME, and BD, respectively; n(Ti) is the molar number of Ti in TS-1, provided by ICP-OES; and t is the reaction time, which is 1 h in this article.
4. Conclusions
TS-1 with little extraframework titanium species has been successfully synthesized with the assistance of starch in a TPAOH hydrothermal system. The addition of starch can slow the crystallization so that the crystallization rates of titanium and silicon match well. As a result, the content of tetrahedrally coordinated titanium increases, and the formation of anatase TiO2 is inhibited. The content of octahedrally coordinated titanium decreased and then increased with an increase in the amount of starch added.
TS-1 synthesized with starch shows a higher catalytic activity in the epoxidation of 1-butene than that synthesized without starch. The highest catalytic activity is obtained for TS-1-0.4 due to the highest content of tetrahedrally coordinated titanium and lowest anatase TiO2 content and octahedrally coordinated titanium.
Acknowledgments
This work was financially supported by the National Key Research and Development Program of China (2016YFB0301704), the National Natural Science Foundation of China (21506021), the Fundamental Research Funds for the Central Universities (DUT16RC(4)11), and the China Postdoctoral Science Foundation (2014M551094).
Supporting Information Available
The Supporting Information is available free of charge on the ACS Publications website at DOI: 10.1021/acsomega.6b00266.
Properties and structure of the starch used in this article (PDF)
Author Contributions
§ T.Z. and Y.Z. contributed equally and should be considered co-first authors.
The authors declare no competing financial interest.
Supplementary Material
References
- Taramasso M.; Perego G.; Notari B.. Preparation of Porous Crystalline Synthetic Material Comprised of Silicon and Titanium Oxides U.S. Patent 4,410,501, Oct 18, 1983.
- Wang X. B.; Zhang X. F.; Wang Y.; Liu H.; Qiu J. S.; Wang J. Q.; Han W.; Yeung K. L. ACS Catal. 2011, 1, 437–445. 10.1021/cs1001509. [DOI] [Google Scholar]
- Kuwahara Y.; Nishizawa K.; Nakajima T.; Kamegawa T.; Mori K.; Yamashita H. J. Am. Chem. Soc. 2011, 133, 12462–12465. 10.1021/ja205699d. [DOI] [PubMed] [Google Scholar]
- Cordeiro P. J.; Don Tilley T. ACS Catal. 2011, 1, 455–467. 10.1021/cs200017s. [DOI] [Google Scholar]
- Wu M.; Song H. L.; Chou L. J. RSC Adv. 2013, 3, 23562–23570. 10.1039/c3ra43035a. [DOI] [Google Scholar]
- Kerton O. J.; McMorn P.; Bethell D.; King F.; Hancock F.; Burrows A.; Kiely C. J.; Ellwood S.; Hutchings G. Phys. Chem. Chem. Phys. 2005, 7, 2671–2678. 10.1039/b503241e. [DOI] [PubMed] [Google Scholar]
- Shan Z.; Lu Z.; Wang L.; Zhou C.; Ren L.; Zhang L.; Meng X.; Ma S.; Xiao F. ChemCatChem 2010, 2, 407–412. 10.1002/cctc.200900312. [DOI] [Google Scholar]
- Sasaki M.; Sato Y.; Tsuboi Y.; Inagaki S.; Kubota Y. ACS Catal. 2014, 4, 2653–2657. 10.1021/cs5007926. [DOI] [Google Scholar]
- Huybrechts D. R. C.; Debruycker L.; Jacobs P. A. Nature 1990, 345, 240–242. 10.1038/345240a0. [DOI] [Google Scholar]
- Wang J. G.; Zhao Y. L.; Yokoi T.; Kondo J. N.; Tatsumi T. ChemCatChem 2014, 6, 2719–2726. 10.1002/cctc.201402239. [DOI] [Google Scholar]
- Mantegazza M. A.; Leofanti G.; Petrini G.; Padovan M.; Zecchina A.; Bordiga S. Stud. Surf. Sci. Catal. 1994, 82, 541–550. 10.1016/s0167-2991(08)63447-3. [DOI] [Google Scholar]
- Xu L.; Peng H.; Zhang K.; Wu H.; Chen L.; Liu Y.; Wu P. ACS Catal. 2013, 3, 103–110. 10.1021/cs3006007. [DOI] [Google Scholar]
- Yang L. B.; Xin F.; Lin J. Z.; Zhuang Z.; Sun R. RSC Adv. 2014, 4, 27259–27266. 10.1039/C4RA01789G. [DOI] [Google Scholar]
- Kong L. Y.; Li G.; Wang X. S. Catal. Today 2004, 93–95, 341–345. 10.1016/j.cattod.2004.06.016. [DOI] [Google Scholar]
- Gao G.; Cheng S.; An Y.; Si X.; Xu X.; Liu Y.; Zhang H.; Wu P.; He M. ChemCatChem 2010, 2, 459–466. 10.1002/cctc.200900073. [DOI] [Google Scholar]
- Lv Q.; Li G.; Sun H. Y. Fuel 2014, 130, 70–75. 10.1016/j.fuel.2014.04.042. [DOI] [Google Scholar]
- Shen C.; Wang Y. J.; Xu J. H.; Luo G. S. Chem. Eng. J. 2015, 259, 552–561. 10.1016/j.cej.2014.08.027. [DOI] [Google Scholar]
- Millini R.; Massara E. R.; Perego G.; Bellussi G. J. Catal. 1992, 137, 497–503. 10.1016/0021-9517(92)90176-I. [DOI] [Google Scholar]
- Lamberti C.; Bordiga S.; Zecchina A.; Artioli G.; Marra G.; Spanò G. J. Am. Chem. Soc. 2001, 123, 2204–2212. 10.1021/ja003657t. [DOI] [PubMed] [Google Scholar]
- Bordiga S.; Damin A.; Bonino F.; Ricchiardi G.; Zecchina A.; Tagliapietra R.; Lamberti C. Phys. Chem. Chem. Phys. 2003, 5, 4390–4393. 10.1039/b306041c. [DOI] [Google Scholar]
- Clerici M. G.; Bellussi G.; Romano U. J. Catal. 1991, 129, 159–167. 10.1016/0021-9517(91)90019-Z. [DOI] [Google Scholar]
- Su J.; Xiong G.; Zhou J. C.; Liu W. H.; Zhou D. H.; Wang G. R.; Wang X. S.; Guo H. C. J. Catal. 2012, 288, 1–7. 10.1016/j.jcat.2011.12.006. [DOI] [Google Scholar]
- Wang L. L.; Xiong G.; Su J.; Li P.; Guo H. C. J. Phys. Chem. C 2012, 116, 9122–9131. 10.1021/jp3017425. [DOI] [Google Scholar]
- Wu L. Z.; Deng X. J.; Zhao S. F.; Yin H. M.; Zhuo Z. X.; Fang X. Q.; Liu Y. M.; He M. Y. Chem. Commun. 2016, 52, 8679–8682. 10.1039/C6CC03318K. [DOI] [PubMed] [Google Scholar]
- Liu Z.; Davis R. J. J. Phys. Chem. 1994, 98, 1253–1261. 10.1021/j100055a035. [DOI] [Google Scholar]
- Thangaraj A.; Sivasanker S. J. Chem. Soc., Chem. Commun. 1992, 2, 123–124. 10.1039/c39920000123. [DOI] [Google Scholar]
- Prasad M. R.; Kamalakar G.; Kulkarni S. J.; Raghavan K. V.; Rao K. N.; Prasad P. S. S.; Madhavendra S. S. Catal. Commun. 2002, 3, 399–404. 10.1016/S1566-7367(02)00144-9. [DOI] [Google Scholar]
- Huang D. G.; Zhang X.; Chen B. H.; Chao Z. S. Catal. Today 2010, 158, 510–514. 10.1016/j.cattod.2010.07.027. [DOI] [Google Scholar]
- Zhang G.; Johan S. A.; Schoeman B. Chem. Mater. 1997, 9, 210–217. 10.1021/cm960298l. [DOI] [Google Scholar]
- Wang X. S.; Guo X. W.; Wang L. Stud. Surf. Sci. Catal. 2004, 154, 2589–2595. 10.1016/S0167-2991(04)80528-7. [DOI] [Google Scholar]
- Cundy C. S.; Forrest J. O. Microporous Mesoporous Mater. 2004, 72, 67–80. 10.1016/j.micromeso.2004.04.006. [DOI] [Google Scholar]
- Fan W. B.; Duan R. G.; Yokoi T.; Wu P.; Kubota Y.; Tatsumi T. J. Am. Chem. Soc. 2008, 130, 10150–10164. 10.1021/ja7100399. [DOI] [PubMed] [Google Scholar]
- Zuo Y.; Liu M.; Zhang T.; Hong L. W.; Guo X. W.; Song C. S.; Chen Y. S.; Zhu P. Y.; Cherno J.; Daniel F. RSC Adv. 2015, 5, 17897–17904. 10.1039/C5RA00194C. [DOI] [Google Scholar]
- Wang Y. M.; He J. Q.. Method for Adjusting pH Value with Oligosaccharide during Synthesizing Titanium Silicalite Molecular Sieve (TS-1). China Patent CN 201210048648, Oct 30, 2013.
- Tao H. X.; Li C. L.; Ren J. W.; Wang Y. Q.; Lu G. Z. J. Solid State Chem. 2011, 184, 1820–1827. 10.1016/j.jssc.2011.05.023. [DOI] [Google Scholar]
- Treacy M. M. J.; Higgins J. B.. Collection of Simulated XRD Powder Patterns for Zeolites, 5th ed.; Elsevier: Amsterdam, 2007; p 276. [Google Scholar]
- Coudurier G.; Naccache C.; Vedrine J. C. J. Chem. Soc., Chem. Commun. 1982, 1413–1415. 10.1039/c39820001413. [DOI] [Google Scholar]
- Burkett S. L.; Davis M. E. J. Phys. Chem. 1994, 98, 4647–4653. 10.1021/j100068a027. [DOI] [Google Scholar]
- Burkett S. L.; Davis M. E. Chem. Mater. 1995, 7, 920–928. 10.1021/cm00053a017. [DOI] [Google Scholar]
- Tozzola G.; Mantegazza M. A.; Ranghino G.; Petrini G.; Bordiga S.; Ricchiardi G.; Lamberti C.; Zulian R.; Zecchina A. J. Catal. 1998, 179, 64–71. 10.1006/jcat.1998.2205. [DOI] [Google Scholar]
- Bordiga S.; Damin A.; Berlier G.; Bonino F.; Ricchiardi G.; Zecchina A.; Lamberti C. Int. J. Mol. Sci. 2001, 2, 167. 10.3390/i2050167. [DOI] [Google Scholar]
- Boccuti R. M.; Rao K. M.; Zecchina A.; Leofanti G.; Petrini G. Stud. Surf. Sci. Catal. 1989, 48, 133–144. 10.1016/S0167-2991(08)60677-1. [DOI] [Google Scholar]
- Kumar P.; Gupta J. K.; Muralidhar G.; Prasada Rao T. S. R. Stud. Surf. Sci. Catal. 1998, 113, 463–472. 10.1016/S0167-2991(98)80320-0. [DOI] [Google Scholar]
- Jorda E.; Tuel A.; Teissier R.; Kervennal J. Zeolites 1997, 19, 238–245. 10.1016/S0144-2449(97)00067-5. [DOI] [Google Scholar]
- Geobaldo F.; Bordiga S.; Zecchina A.; Giamello E.; Leofanti G.; Petrini G. Catal. Lett. 1992, 16, 109–115. 10.1007/BF00764360. [DOI] [Google Scholar]
- Vayssilov G. N. Catal. Rev. 1997, 39, 209–251. 10.1080/01614949709353777. [DOI] [Google Scholar]
- Petrini G.; Cesana A.; De Alberti G.; Genoni F.; Leofanti G.; Padovan M.; Paparatto G.; Roffia P. Stud. Surf. Sci. Catal. 1991, 68, 761–766. 10.1016/S0167-2991(08)62710-X. [DOI] [Google Scholar]
- Blasco T.; Camblor M. A.; Corma A.; Pérez-Pariente J. J. Am. Chem. Soc. 1993, 115, 11806–11813. 10.1021/ja00078a020. [DOI] [Google Scholar]
- Li C.; Xiong G.; Xin Q.; Liu J. K.; Ying P. L.; Feng Z. C.; Li J.; Yang W. B.; Wang Y. Z.; Wang G. R.; Liu X. Y.; Lin M.; Wang X. Q.; Min E. Z. Angew. Chem., Int. Ed. 1999, 38, 2220–2221. . [DOI] [PubMed] [Google Scholar]
- Li C.; Xiong G.; Liu J. K.; Ying P. L.; Xin Q.; Feng Z. C. J. Phys. Chem. B 2001, 105, 2993–2997. 10.1021/jp0042359. [DOI] [Google Scholar]
- Guo Q.; Sun K.; Feng Z. C.; Li G. N.; Guo M. L.; Fan F. T.; Li C. Chem. Eur. J. 2012, 18, 13854–13860. 10.1002/chem.201201319. [DOI] [PubMed] [Google Scholar]
- Xiong G.; Cao Y. Y.; Guo Z. D.; Jia Q. Y.; Tian F. P.; Liu L. P. Phys. Chem. Chem. Phys. 2016, 18, 190–196. 10.1039/C5CP05268H. [DOI] [PubMed] [Google Scholar]
- Wang L. Q.; Wang X. S.; Guo X. W.; Li G.; Xiu Y. H. Chin. J. Catal. 2001, 22, 513–514. [Google Scholar]
Associated Data
This section collects any data citations, data availability statements, or supplementary materials included in this article.


