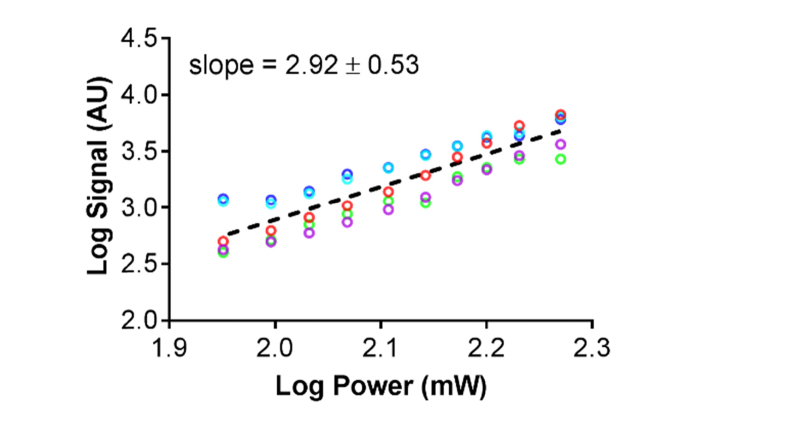
Fig. 3.
PFC nanodroplets phase-change signals are a THG process. Single focal plane images of n = 5 microbubbles were collected using 1280 nm excitation over a range of laser powers (89-186 mW). Log-log transformed signal-power data sets (colored circles, n = 5) from 5 microbubbles at 4 independent positions are plotted with a fit line (dashed line) that represents the means of slopes and y-intercepts obtained from linear regressions of each of the five data sets. The mean slope of ~3 indicates a third order process.

