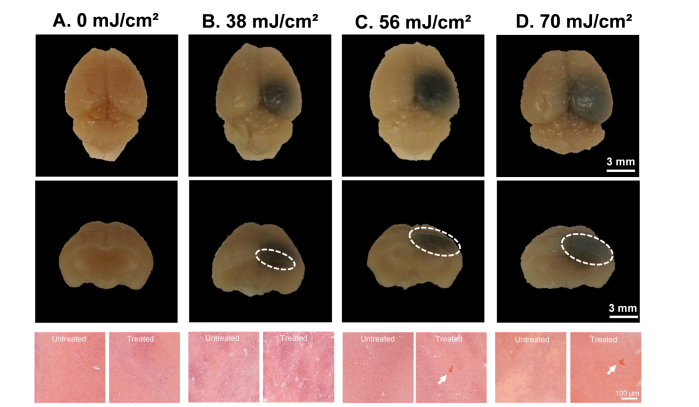
Fig. 3.
Representative Evans Blue (EB) dye extravasation top view and cross-sectional photographs and hemotoxalyin & eosin (H&E) pictomicrographs for varying laser fluences. EB dye extravasation is outlined on the coronal cross-section with a white, dashed oval. H&E pictomicrographs are shown for both treated (right) and untreated (left) sides of the brain, with presence of red blood cells indicated by a white arrow and bright red staining within the tissue. Laser fluences include (A) 0 mJ/cm2, (B) 38 mJ/cm2, (C) 56 mJ/cm2, and (D) 70 mJ/cm2. Note: Laser fluence A and C use the same images as laser pulse Figs. 2(A) and 2(C), and experiments shown in B–D were performed with 600 laser pulses.

