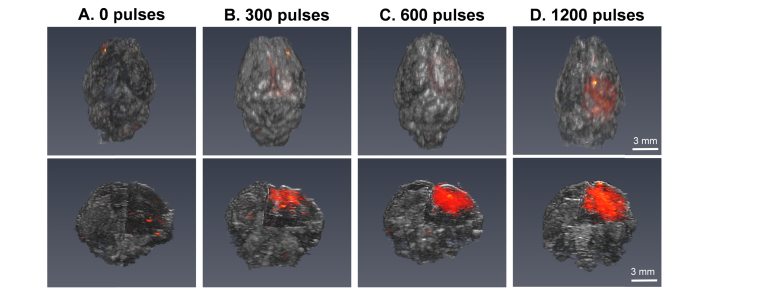
Fig. 5.
Reconstructed 3D top view and right side, corner cut images of ultrasound (US, grayscale) and photoacoustic (PA, hot colormap) data for varying number of laser pulses: (A) 0 pulses, (B) 300 pulses, (C) 600 pulses, and (D) 1200 pulses. Note: Laser pulse A and C use the same images as laser fluence Figs. 6(A) and 6(C), and experiments shown in B–D were performed with a laser fluence of 56 mJ/cm2.

