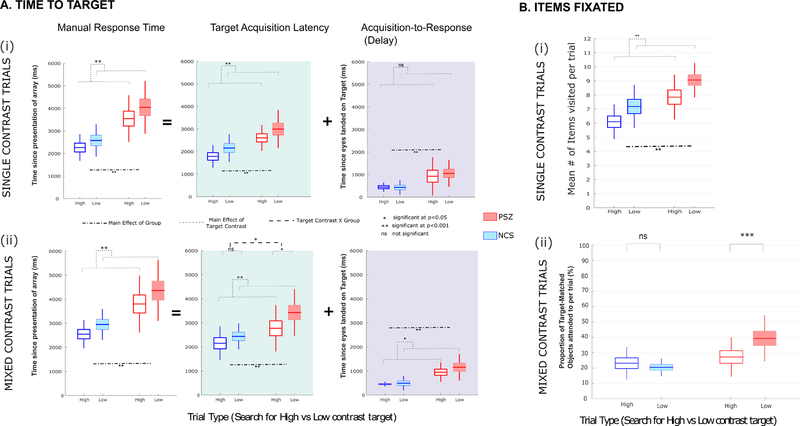
Figure 2. A. Time to Target.
Three different measures of timing are depicted. The left side (unshaded) shows the manual RT. The other two measures break the manual RT into two components: the amount of time required for gaze to reach (acquire) the target (target acquisition latency, middle panels; and the delay between target acquisition and the manual response [acquisition-to-response time, right panels]. The top panels depict these measures for Single-contrast trials, and the bottom panel for mixed-contrast trials. Time from onset of search array is shown, separated by trial type. B. Items Fixated: The figure displays the proportion of unique target-mismatched distractors relative to all items fixated.

