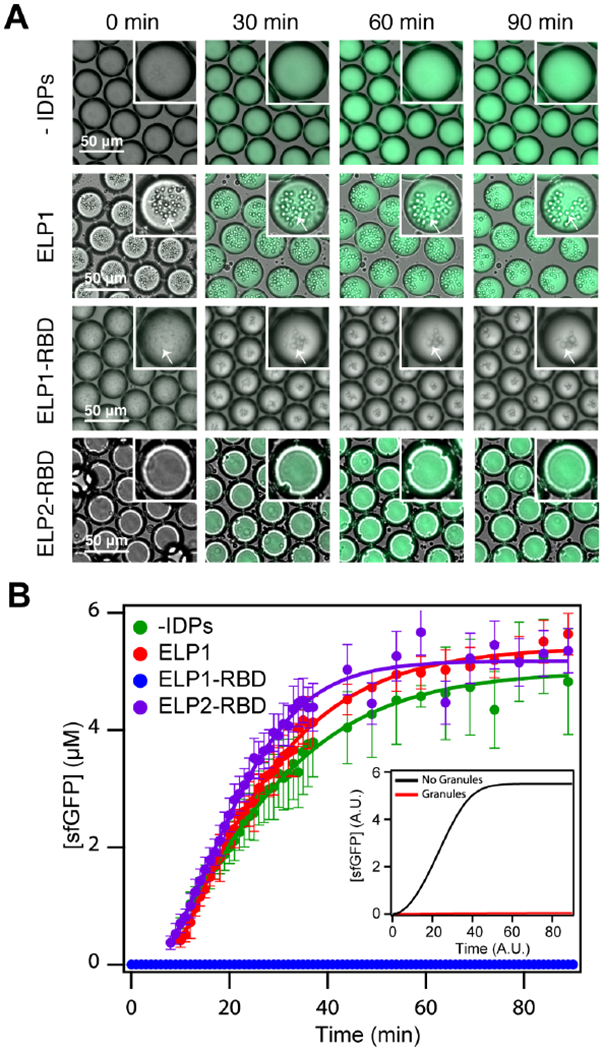
Figure 4. Engineered mRNP granules suppress sfGFP translation.

(A) Overlaid brightfield and fluorescence time-lapse images of droplets containing IVTT components and superfolder GFP plasmid (1 μg 50 μL−1) in the absence of an IDP (top row), with ELP1 (second row), with ELP1-RBD (third row), and ELP2-RBD (fourth row). White arrows indicate liquid coacervates. ELP1, ELP1-RBD, and ELP2-RBD concentration is 500 μM, and the temperature is 37°C. (B) Superfolder GFP concentration as a function of time in droplets without an IDP (green points), with ELP1 (red points), with ELP1-RBDs (blue points), and with ELP2-RBDs (purple points). Solid lines represent the best sigmoidal fit and the error bars represent the standard deviation (n ≥ 50 droplets). The inset shows simulated sfGFP concentration in the droplets (black) or the irreversible suppression of translation by granules (red). See STAR Methods for details on model formulation and analysis. Related to Supplementary Table 1, Supplementary Figures 2–3, and Supplementary Movies M4–7.
