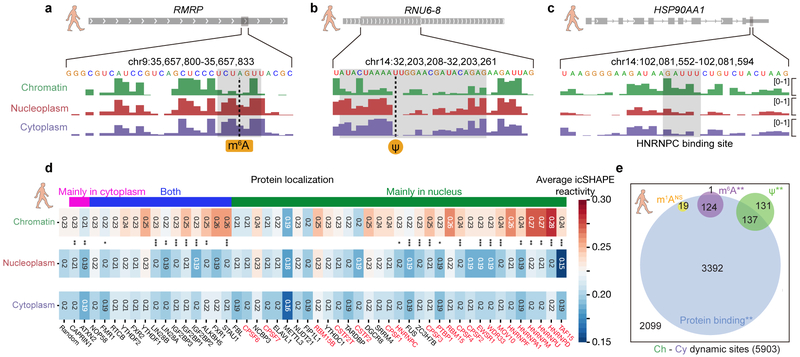
Fig 4 ∣. RNA modification and RBP binding underlie RNA structural changes.
a-c, RNA structural change at (a) an m6A-modified site, (b) a Ψ-modified site, and (c) an HNRNPC-binding site. Tracks show the icSHAPE score plotted along the RNA sequence. d, Heatmap of average icSHAPE scores in RBP binding regions in different cellular compartments, ranked by increasing structural change (from left to right) between the chromatin and the nucleoplasmic fractions. Proteins are annotated by their known localizations, with chromatin-associated RBPs shown in red. P-values were calculated by single-sided Mann-Whitney U test and corrected by the Bonferroni method. Source data for panel d are available online. e, The number and overlap of different types of RNA modification sites and RBP binding sites in regions with RNA structural change. P-values were calculated by a permutation test for 1,000 times. * p-value < 0.05; ** p-value < 1e-3; *** p-value < 1e-5.

