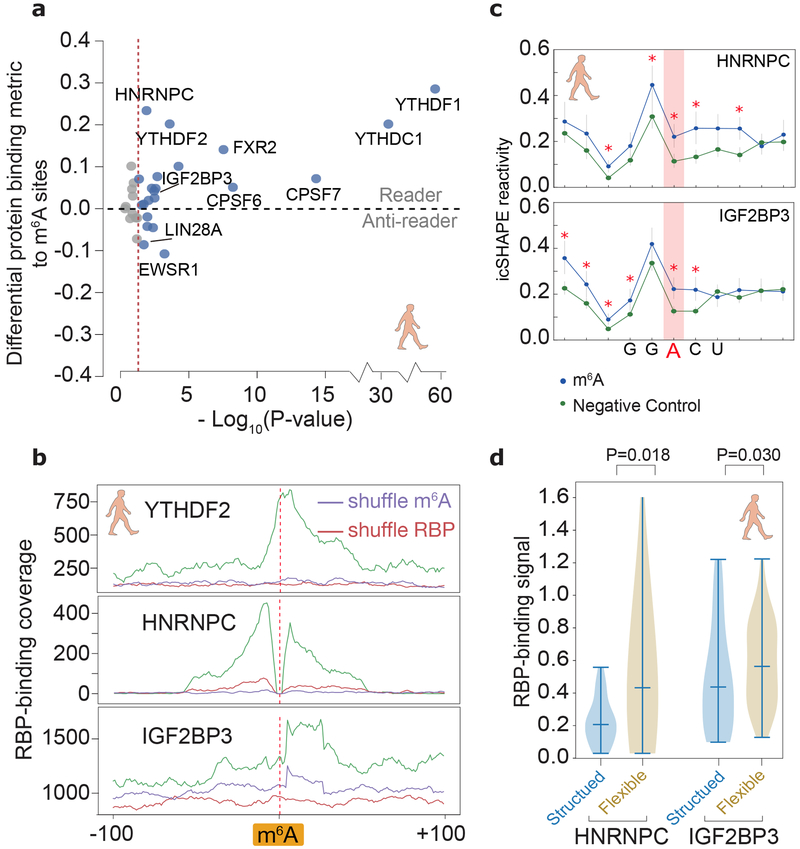
Fig 5 ∣. Structural analysis dissects different types of m6A readers.
a, Differential RBP binding to m6A sites and control sites containing an m6A motif. P-values are calculated to show the statistical significance of the binding differences by single-sided Mann-Whitney U test and corrected by the Benjamini/Hochberg method. Source data for panel a are available online. b, Metagene profiles of protein binding in m6A-flanking regions. c, Metagene profiles showing that RNA structures are different between known m6A-modified sites and unmodified sites (negative control), at m6A motifs overlapping a binding site of IGF2BP3 and HNRNPC. P-values were calculated by single-sided Mann-Whitney U test, red asterisks, p-values less than 0.01. The error bars represent the standard error of the mean. The numbers of HNRNPC and IGF2BP3 binding regions are 86 and 56, respectively. d, Violin plots of RBP-binding strengths of HNRNPC and IGF2BP3 in structured and flexible regions containing a m6A motif. Structured and flexible regions are defined as the RBP-binding regions at the bottom 30% or top 30% of average icSHAPE scores, respectively. P-values were calculated by single-sided Mann-Whitney U test. The numbers of HNRNPC and IGF2BP3 binding regions in comparison are 137 and 320, respectively.

