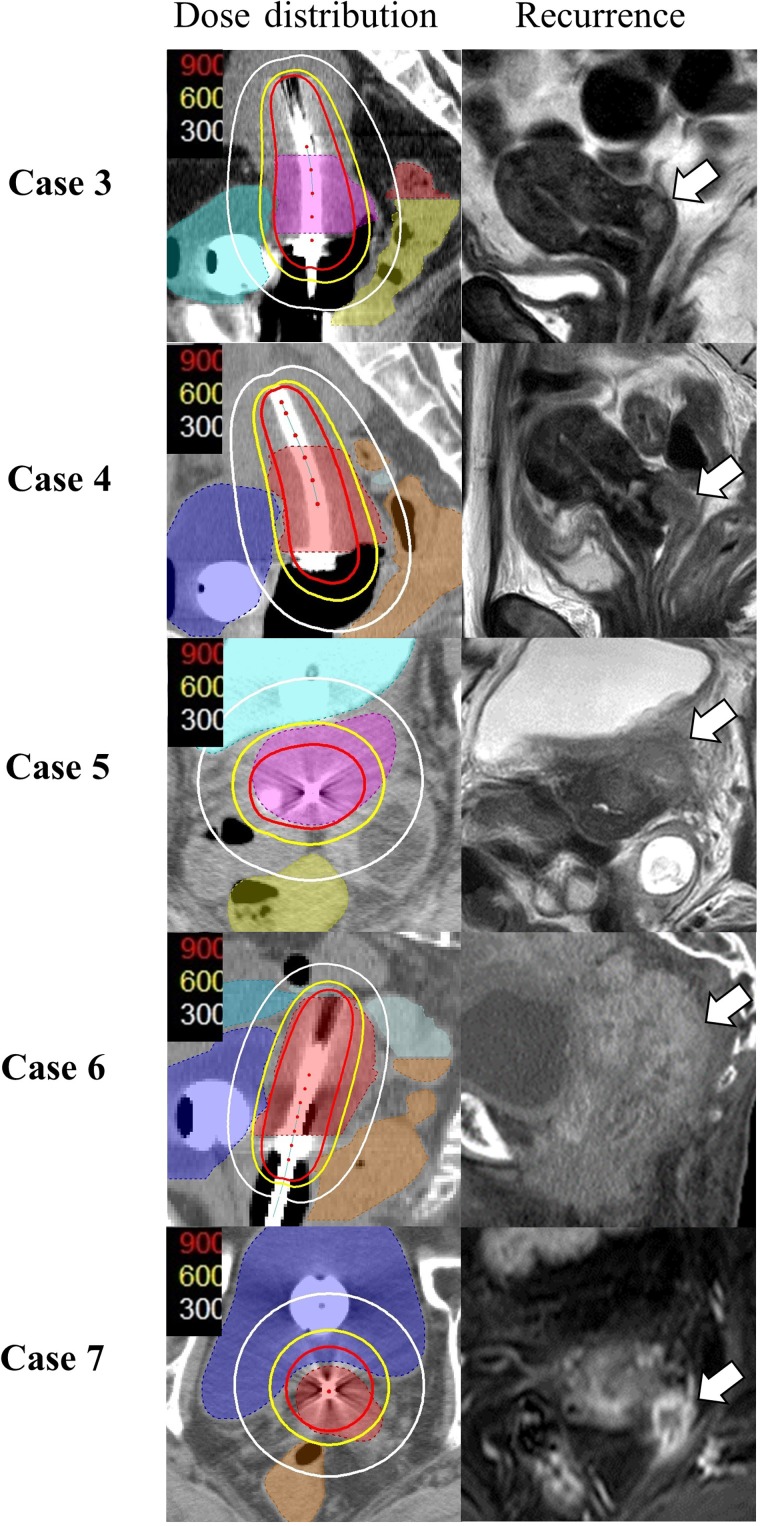
Figure 2.
Dose distributions at brachytherapy (BT) and patterns of local recurrence within the primary tumor. HR-CTV of BT sessions only are shown. The white, yellow and red lines represent the 3-, 6- and 9-Gy isodose lines, respectively. White arrows show the sites of local recurrence. Note that the regions of local recurrence were outside the 6-Gy isodose lines in all cases.

