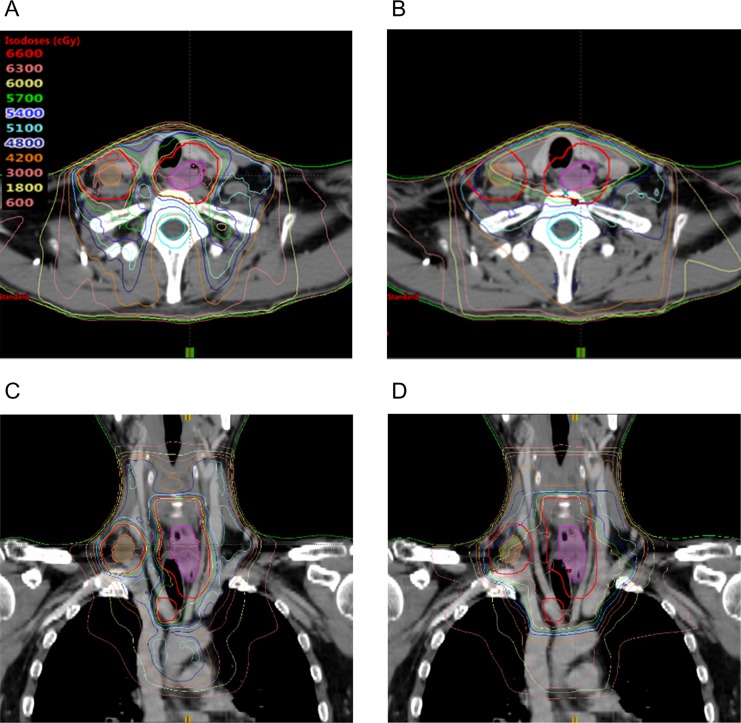
Fig. 2.
Axial and coronal images of the dose distribution of (A, C) simultaneous integrated boost intensity-modulated radiotherapy and (B, D) 3D conformal radiotherapy. Magenta translucent contour: primary tumor; orange translucent contour: metastatic lymph nodes; red contour: sum of the planning target volume of the primary tumor and the metastatic lymph nodes.

