Figure 3.

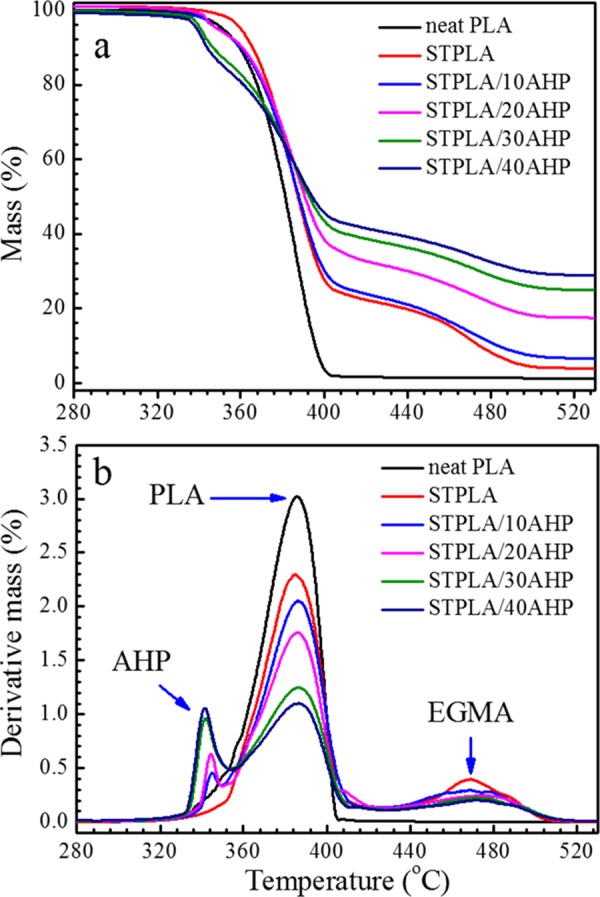
Mass loss curves (a) and derivative mass loss curves (b) from TGA measurements for neat PLA, STPLA, and STPLA/xAHP with different AHP contents under nitrogen atmosphere.

Mass loss curves (a) and derivative mass loss curves (b) from TGA measurements for neat PLA, STPLA, and STPLA/xAHP with different AHP contents under nitrogen atmosphere.