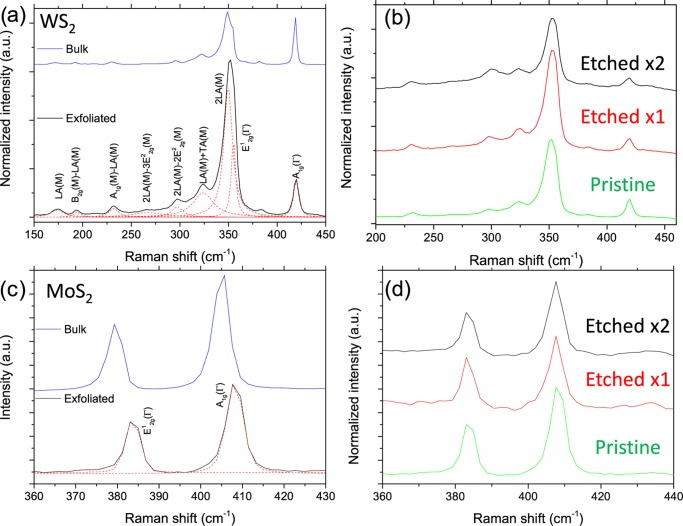
Figure 3.
(a) Comparison of the Raman spectra of the bulk WS2 powder (blue) and the solution-exfoliated WS2 flakes (black) after deposition onto SiO2, along with Lorentzian fitting and labeling according to literature peak assignments.44 (b) Raman spectra of the same WS2 flake after repeated laser etching. The spectra are normalized to the intensity of the A1g peak. (c) Comparison of the Raman spectra of the bulk MoS2 powder (blue) and the solution-exfoliated MoS2 flakes (black) after deposition onto SiO2, along with Lorentzian fitting and labeling according to literature peak assignments.47 (d) Raman spectra of the same MoS2 flake after repeated laser etching. The spectra are normalized to the intensity of the A1g peak.

