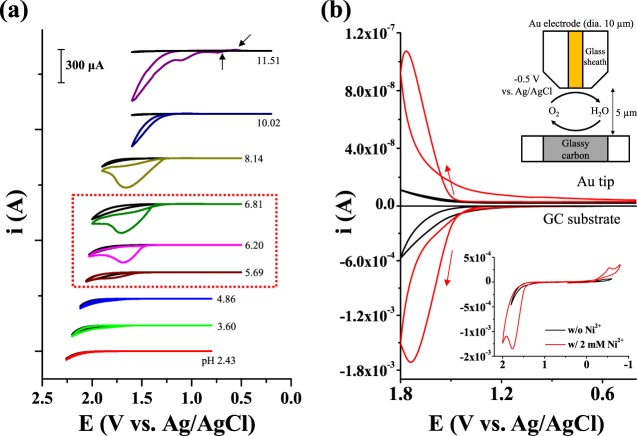
Figure 1.
(a) Cyclic voltammograms (scan rate: 20 mV/s) of FTO (surface area: 0.0314 cm2) in a pH 6.8 phosphate buffer (0.1 M HPO42–/0.1 M H2PO4–) solution of varying pHs containing 2 mM Ni2+. The electrolyte pH was adjusted by adding 0.1 M H2SO4 or 0.1 M NaOH. The black solid lines show cyclic voltammograms measured in Ni-free solutions at each pH. (b) Cyclic voltammogram of a GC substrate in a pH 6.8 phosphate buffer (0.1 M HPO42–/0.1 M H2PO4–) solution containing Ni2+ (scan rate: 20 mV/s) (bottom) and the respective change in the current on a Au tip electrode (top) held at −0.5 V during potential scanning of the GC substrate. The small cathodic peak at −0.5 V in the inset is attributed to the reduction of oxygen absorbed on the electrode surface.

