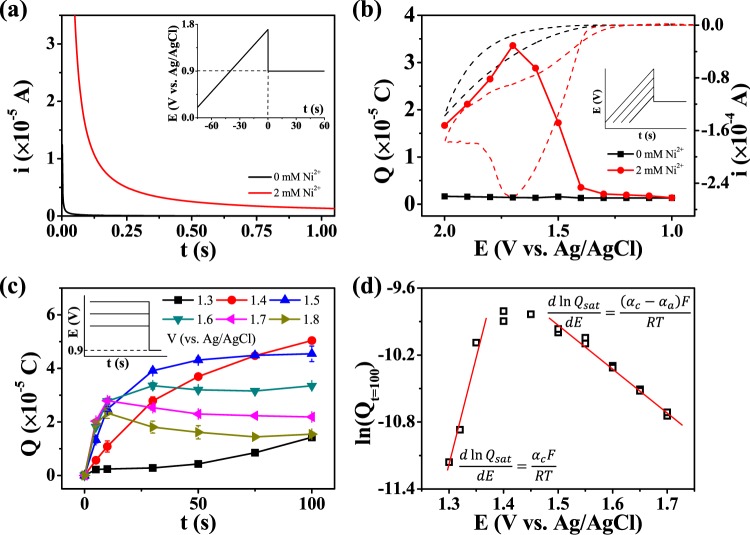
Figure 4.
(a) Current–time response during coulometric titration (0.9 V vs Ag/AgCl for 20 s). (b) A plot of the amount of collected charge with respect to the potential at the end point of cyclic voltammetric scanning. (c) A plot of the amount of collected charge with respect to the time duration of the various potential steps prior to the titration step. (d) A plot of the amount of charge collected at saturation versus the applied potential prior to the titration step.

