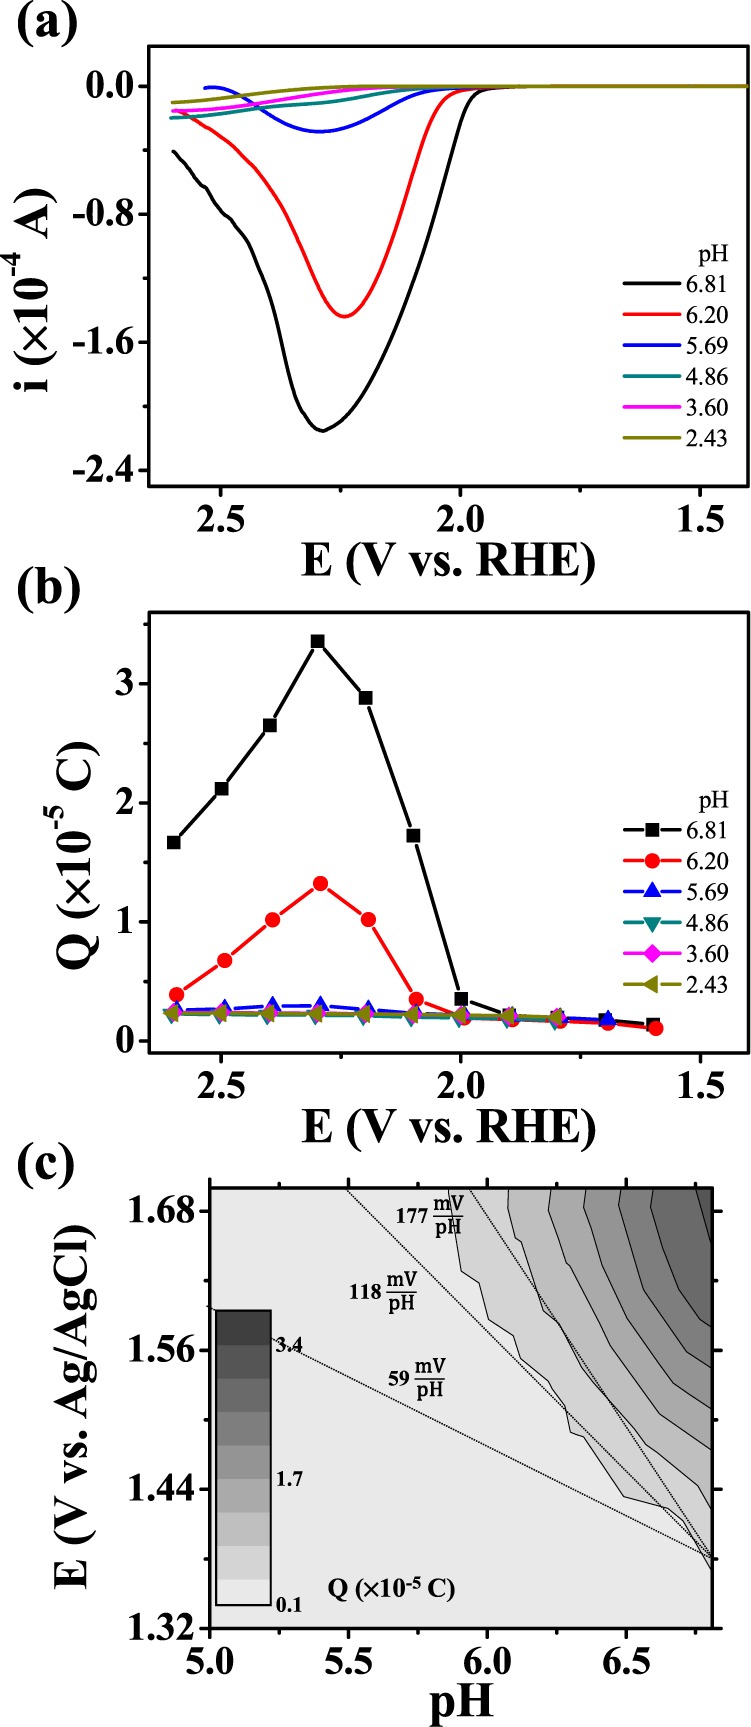
Figure 5.

(a) Cyclic voltammograms (scan rate: 20 mV/s) of FTO (surface area: 0.0314 cm2) and (b) the relevant charge collected, in a pH 6.8 phosphate buffer (0.1 M HPO42–/0.1 M H2PO4–) solution of varying pHs and containing 2 mM Ni2+. (c) The collected charge mapped on the potential-pH plane (Pourbaix diagram).
