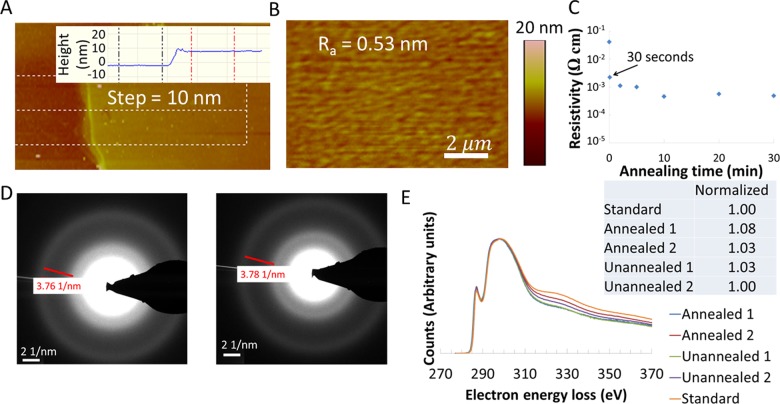
Figure 3.
Measurement of step height, roughness, and sheet resistance of arc-deposited thin-film carbon. (A) AFM measurement showing a 10 nm step height to calibrate the film thickness. The inset is an average over the dotted box. (B) Atomic force microscopy image of the surface and arithmetic average roughness of a thin carbon layer. (C) Semilog plot of the effect of annealing on the sheet resistance of the thin-film carbon. (D) Diffraction pattern before (left) and after (right) annealing. (E) Electron energy loss spectroscopy (EELS) data for annealed and unannealed thin-film carbon compared to those of an sp2 standard.

