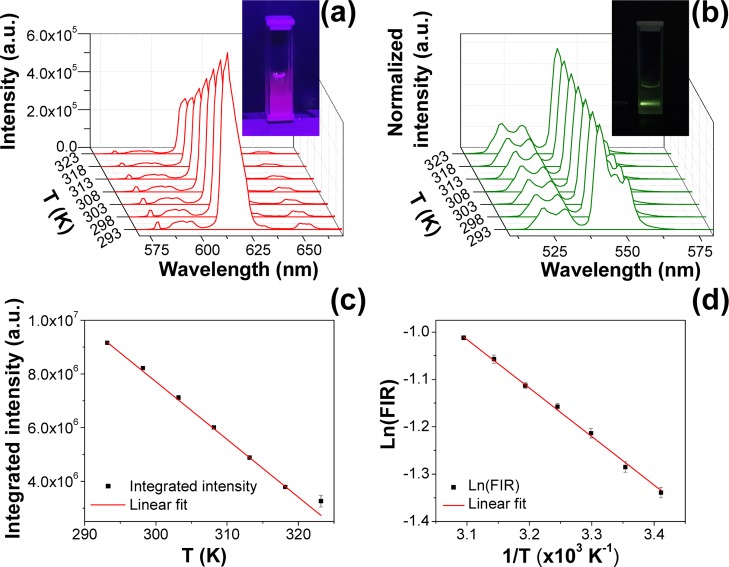
Figure 3.
Emission spectra of UCNPs@SiO2–Eu(tta)3 at different temperatures (293–323 K): under (a) UV and (b) NIR excitation. Insets: Corresponding luminescent photographs. Thermal calibration curves: (c) fluorescence intensity (integrated area) vs temperature (λexc 352 nm) and (d) ln(FIR) vs inverse temperature (λexc 980 nm).

