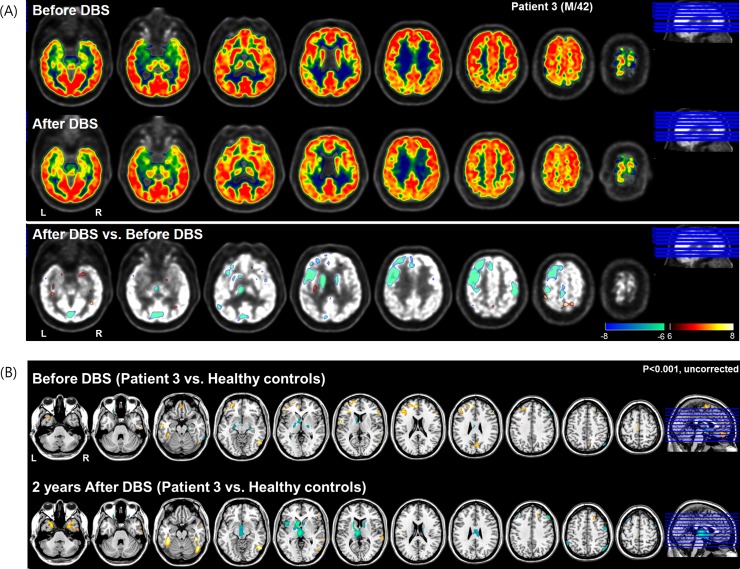
Fig 4. 18Fluorodeoxyglucose-positron emission tomography (FDG-PET) image taken in Subject three at pre-and postoperative 2 years.
(A) Relative to before DBS showed extensively decreased metabolic activity in left frontal including anterior cingulate and bilateral caudate after DBS. (B) This metabolic activity in prefrontal including anterior cingulate regions was hyperactive in before DBS and then at 2 years after DBS, this pattern was recovered or normalized as a normal state (p<0.001, uncorrected for multiple comparisons).

