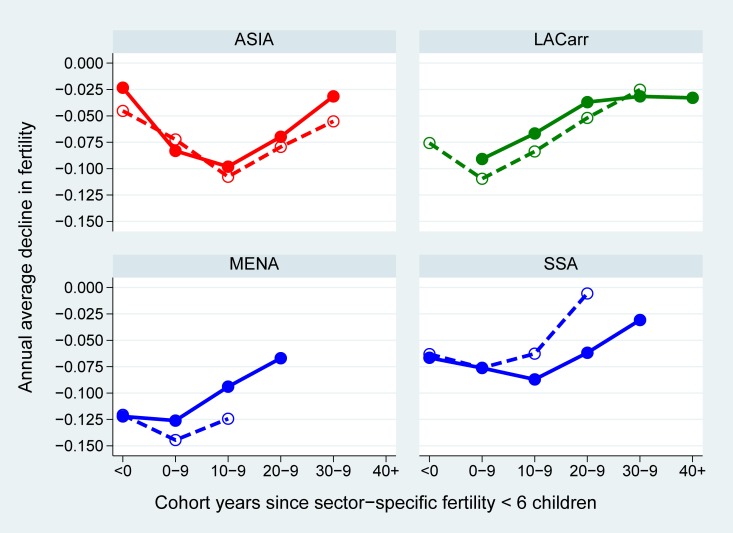
Fig 4. Regional averages of the annual pace of cohort fertility decline in urban and rural areas (full and dashed line, respectively) over the course of the national and sector-specific fertility transitions, cohorts 1896–1982 in 50 African, Asian and Latin American countries.
Source: WFS & DHS, MICS, IPUMS. Notes: full lines indicate the urban pace, dashed lines indicate the rural pace; LACarr = Latin America and the Caribbean, MENA = Middle East and Northern Africa, SSA = sub-Saharan Africa; the onset of the sector-specific transition corresponds to the first cohort with total fertility below 6 children per woman.

