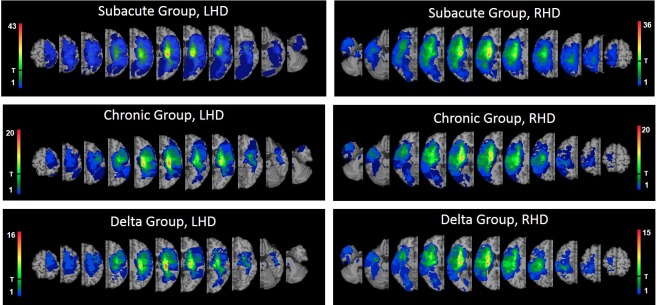
Fig 1. Lesion overlay maps of LHD and RHD patients of the Subacute (n = 65, n = 65; respectively), Chronic (n = 34, n = 32; respectively) and Delta (n = 25, n = 24; respectively) groups.
T = threshold for inclusion in the VLSM analysis: at least 20% of the subjects had to have damage to a particular voxel for it to be included in the analysis. Regions analyzed in each of the 6 figures are those coded by colors above the T mark. Representative normalized slices (out of 90 normalized slices employed) are displayed in radiological convention (right hemisphere on left side and vice versa), with warmer colors indicating greater lesion overlap (units: number of patients with lesion in this region).

