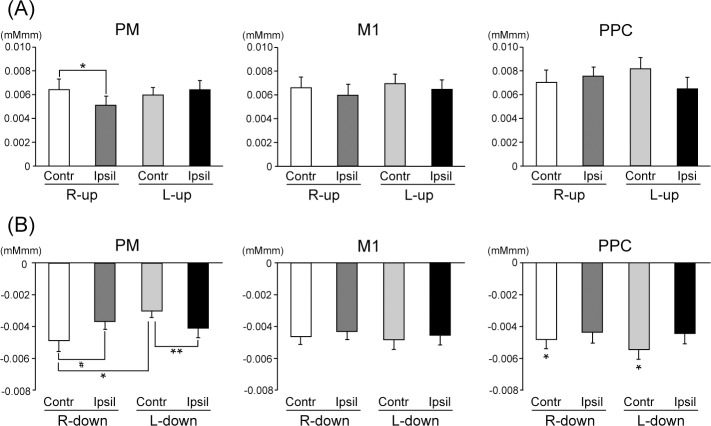
Fig 6.
Mean values for peak amplitudes of oxy-Hb in contra- and ipsilateral hemispheres in the PM, M1, and PPC under (A) Up and (B) Down conditions. Significant differences among tasks are shown as * p < 0.05, and ** p < 0.01. Strong tendency toward a difference is shown as # p < 0.07. Data are expressed as the mean with standard error (SE).

