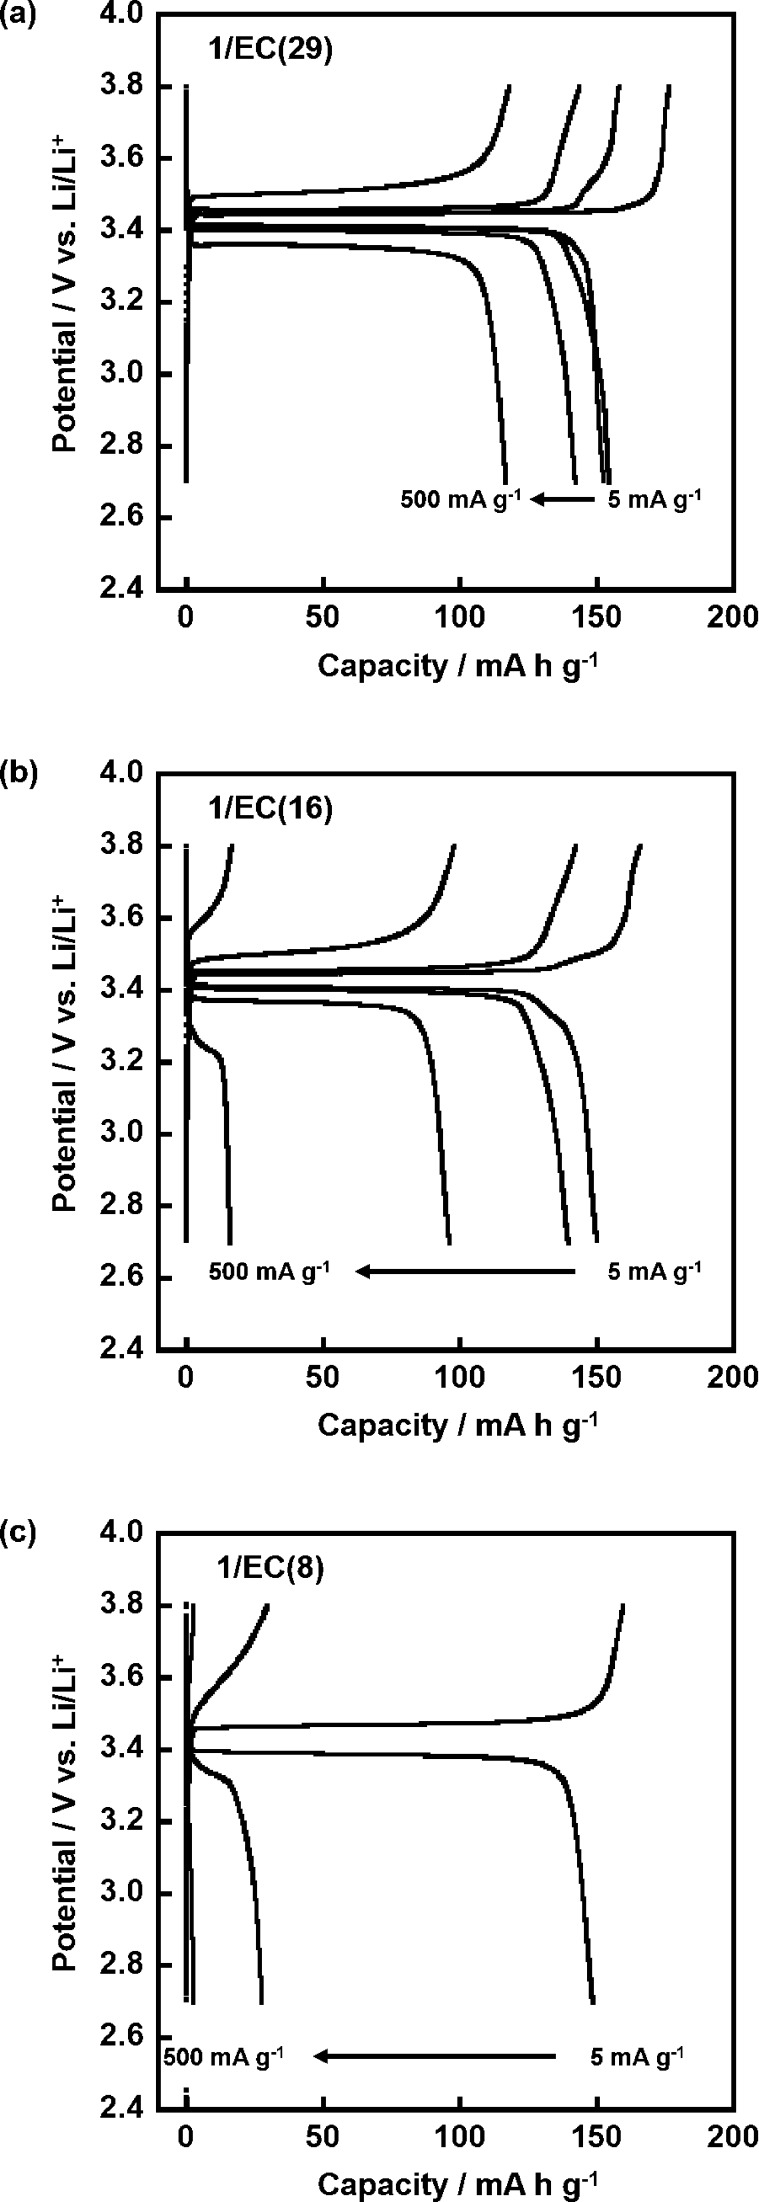
Figure 5.
Charge–discharge profiles of the cells composed of Li/LC electrolyte/LiFePO4 with the electrolytes of (a) 1/EC(29), (b) 1/EC(16), and (c) 1/EC(8) in the potential range of 2.7–3.8 V vs Li/Li+ for successive 5 × 5 cycles at rates of 5, 25, 100, and 500 mA g–1 at 60 °C. The curves correspond to the 2nd cycles at each rate (2nd, 7th, 12th, and 17th cycles in Figure 4).

