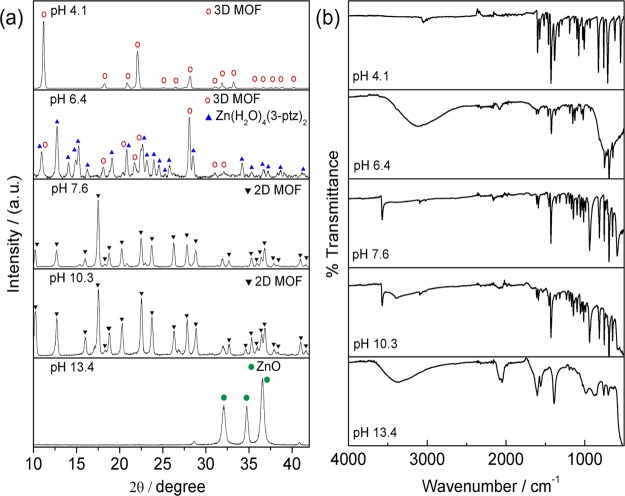
Figure 2.
Structural analysis of the obtained materials as a function of pH. (a) X-ray powder diffraction patterns for five samples obtained at different initial pH values. Diffraction peaks are labeled according to the simulated pattern for Zn(3-ptz)2 (3D MOF), Zn(H2O)4(3-ptz)2·4H2O (ZAC), Zn(OH)(3-ptz) (2D MOF), and zinc oxide (ZnO). (b) Fourier transform infrared spectra for the same samples in (a).

