
Figure 7.
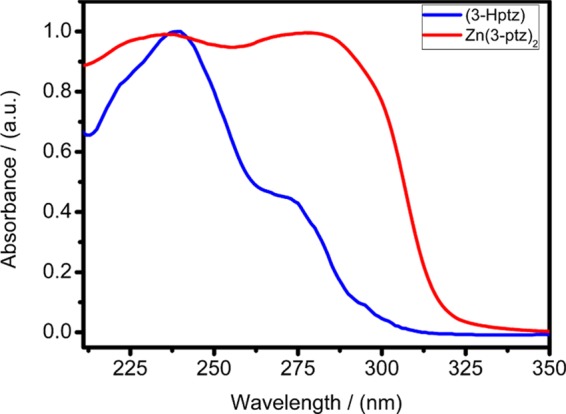
Room-temperature solid-state UV–vis absorption spectrum of Zn(3-ptz)2 MOF (red curve), featuring two strong absorption peaks at 234 and 273 nm. For comparison, the absorption spectrum of the hydrated tetrazole ligand (3-Hptz) in aqueous solution is also shown (blue curve). Zn(3-ptz)2 and (3-Hptz) spectra are normalized by their absorbance at 278 and 240 nm, respectively.