
Figure 4.
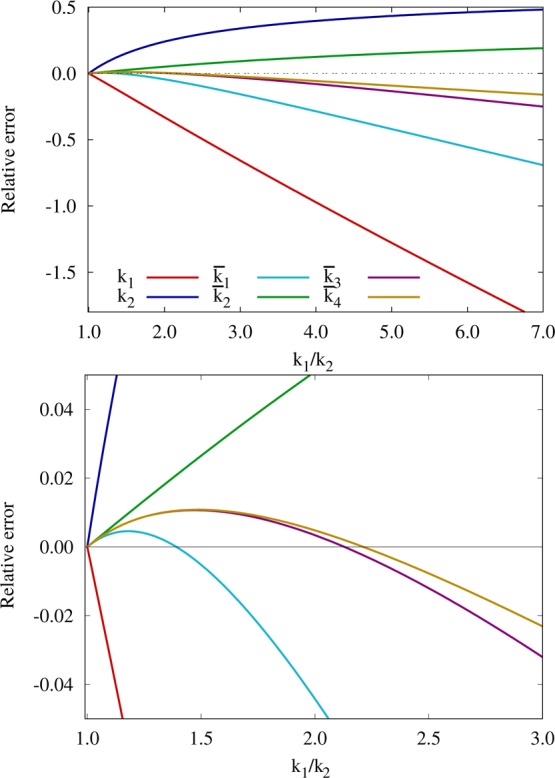
Top: Variation of the relative error in the calculation of the transition state energy (ΔG†) from the Marcus–Hush formula with different curvatures: k1, k2, k̅1, k̅2, k̅3, k̅4 as a function of the curvature ratio, k1/k2, for fixed k2 = 0.05711. Bottom: Detail of the previous plot. Percentage can be obtained from the plots (see text).