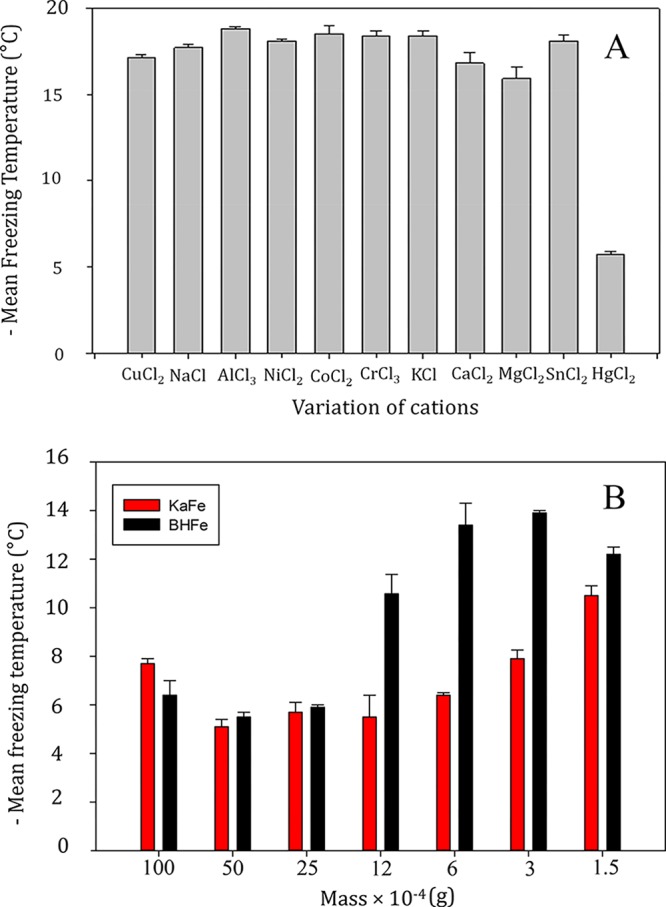
Figure 1.

(A) Bar diagram representing the mean freezing temperature of 3.69 × 10⁻³ M different metal chloride solution with 0.0025 g of KaFe in 10 mL of Milli-Q water. (B) Bar diagram representing the mean freezing temperature of 3.69 × 10⁻³ M HgCl2 with different amounts of BHFe and KaFe in 10 mL of Milli-Q water.
