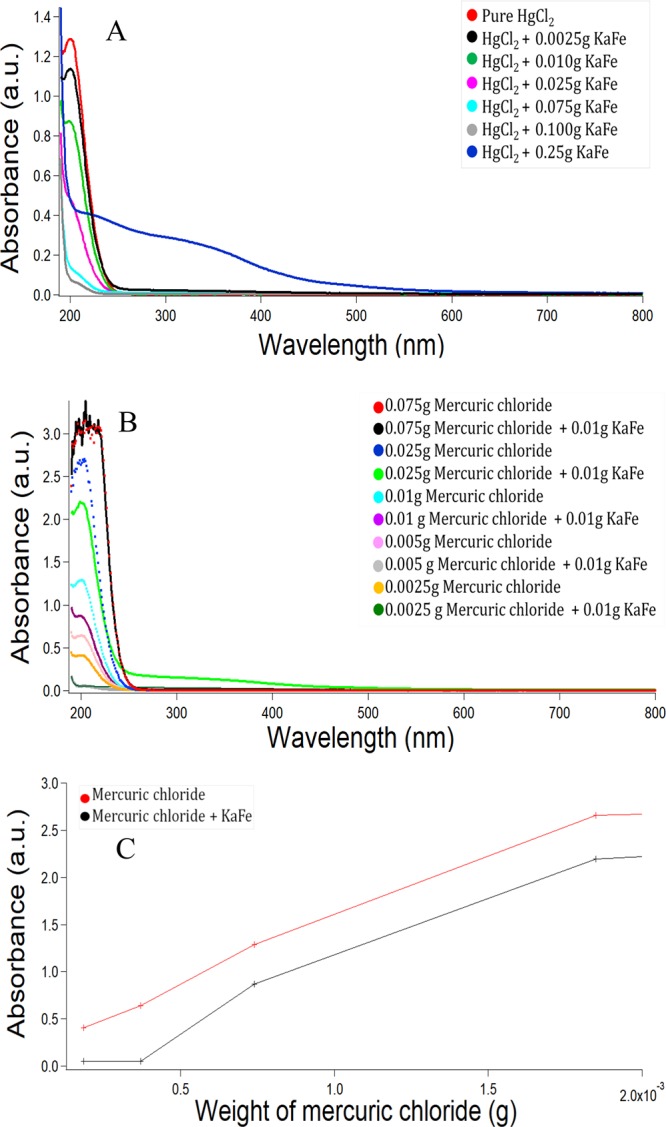
Figure 8.

(A) UV–vis spectra of HgCl2 in the presence of different amounts of KaFe (spectra have been recorded after 13 times dilution), [HgCl2] = 2.84 × 10⁻⁴ M. (B) UV–vis spectra of different amounts of HgCl2 in the presence and absence of fixed amount of KaFe (spectra have been recorded after 13 times dilution). (C) Comparative study of absorbance variation with different amounts of HgCl2 (with and without KaFe) as mentioned in (B).
