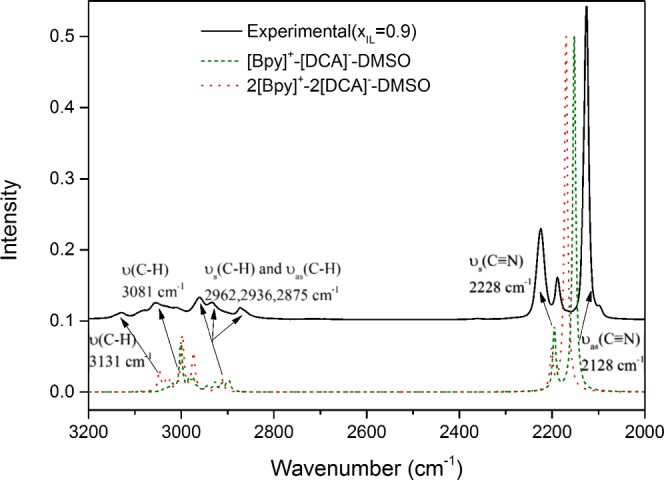
Figure 7.

Measured ATR–FTIR spectra of [Bpy][DCA]/DMSO (xIL = 0.9) at 298.35 K compared to the vibrational frequencies of the corresponding clusters [Bpy]+–[DCA]−–DMSO and 2[Bpy]+–2[DCA]−–DMSO calculated at the B3LYP/6-311++g(d,p) level of the theory (all of the calculated bands were corrected by the factor 0.96385).
