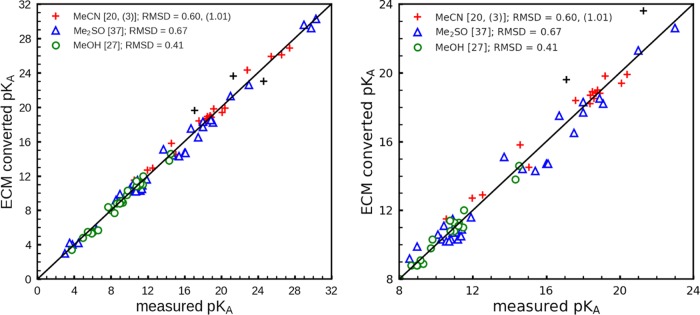
Figure 2.
Correlation diagram for the empirical conversion method (ECM). ECM versus measured pKa values are plotted for the first data set. The ECM pKa values are evaluated according to eq 9 using the pKa values in water obtained with the Jaguar pKa prediction method (JPM)28,29 as the basis. The three outliers for MeCN are denoted by black crosses (+). The numerical values of the pKa are listed in Tables S1–S7 of the Supporting Information. The left part of the figure displays all of the data. The right part is a close-up that focuses on the center pH interval.

