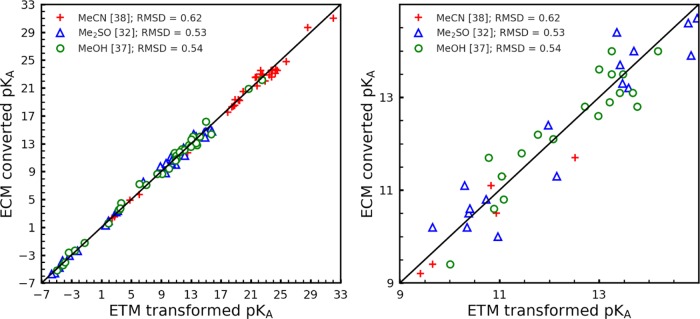
Figure 3.
Correlation diagram for the empirical conversion method (ECM). ECM pKa values are plotted versus with the electrostatic transform method (ETM)27 computed pKa values for the first data set. The ECM pKa values are evaluated according to eq 9 using the pKa values in water obtained with the Jaguar pKa prediction method (JPM)28,29 as the basis. The ETM uses the measured pKa values in water for the transformation to other solvents. The numerical values of the pKa are listed in Tables S1–S7 of the Supporting Information. The left part of the figure displays all of the data. The right part is a close-up that focuses on the center pH interval.

