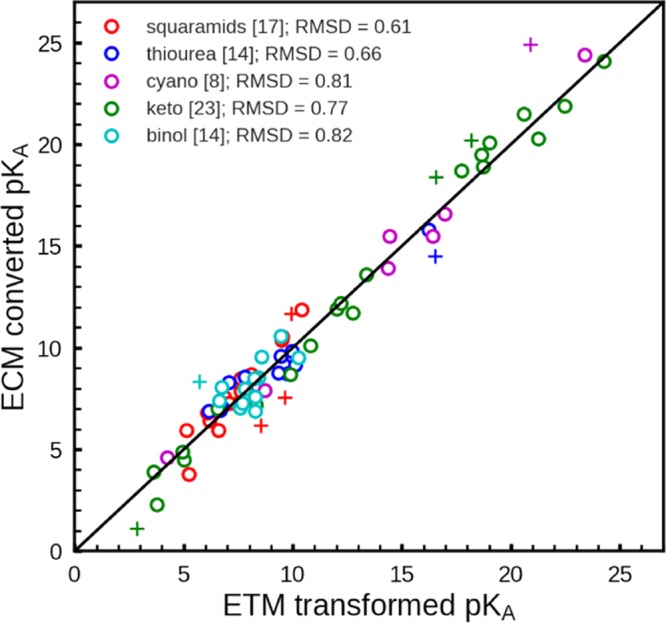
Figure 5.

Correlation diagram for the empirical conversion method (ECM). ECM (converted) pKa values are plotted versus the electrostatic transform method (ETM)27 computed pKa values for the second data set. The latter are based on measured pKa values in DMSO. The ECM pKa values are evaluated according to eq 9 using preliminary pKa values in DMSO obtained with the Jaguar pKa prediction method (JPM)28,29 as the basis. The number of compounds for the individual molecular families is given in the rectangular brackets. Outliers where the pKa values differ by more than 1.5 pH units are denoted with “+”. The numerical values of the pKa are listed in Tables S8–S12 of the Supporting Information.
