Abstract
This study examines the application of poultry eggshell (PES) as a source of calcium for the synthesis of hydroxyapatite (HA) via annealation. The synthesized powder (poultry eggshell hydroxyapatite (PESHA)) was characterized by X-ray diffraction (XRD), Fourier transform infrared (FTIR), scanning electron microscopy (SEM), EDAX, and transmission electron microscopy (TEM) analytical techniques. This powder was used for adsorptive removal of the Reactive Yellow 4 (RY4) dye in a batch process. Results from morphological analysis by SEM and TEM revealed that the microstructure of the apatite is made up of needle–rod-like particles with the length of 15–60 nm, breadth of 4–6 nm, and crystallite size of 86.32 nm. EDAX revealed that HA has Ca/P ratio of 1.63, indicating a nonstoichiometric apatite, whereas XRD analysis presented it as a pure monophasic hydroxyapatite powder. Fourier Transform Infrared (FTIR) spectroscopy indicated that the adsorption is due to the electrostatic interaction between the functional groups of the dye and those on the apatite surface. The maximum adsorption capacity (Qmax) of 127.9 mg g–1 was obtained for the adsorption process, whereas the pseudo-first-order model with R2 > 0.99 best described the adsorption mechanism. Furthermore, the thermodynamic studies revealed that the adsorption process was exothermic and spontaneous in nature with ΔH and ΔS values of 120.79 kJ mol–1 and 0.395 kJ mol–1 K–1, respectively. Thus, hydroxyapatite fabricated from the poultry waste of eggshell can be effectively utilized as an excellent nontoxic and cheap adsorbent for the removal of RY4 dye from aqueous medium.
1. Introduction
Pollutants are ubiquitous in the environment due to rapid urbanization and industrialization, besides portending great danger due to their accumulations in the living tissues; hence, their removal is a germane issue. Effluents from industries such as paint and dyestuff have been the focus of considerable attention in the field of wastewater treatment, not only because of their toxicities but also because of their visibility.1 It is estimated that every year about 280 000 tons of dyes are discharged by the textile industries.1,2 A huge amount of water is needed in dye-related industries for cleaning and washing purposes; however, their waste products containing highly colored effluents with different dyes are often discharged directly into the water systems.3 In the textile industry, for instance, the release of dye waste products into the ecosystem causes environmental pollution because of their toxicity, mutagenicity, and nonbiodegradability.4 Reactive dyes, in particular, have been identified as the most problematic dye, with respect to treatment, among other dyes because of their resistance to conventional methods of wastewater treatment.5,6 They are colored molecules use for dyeing cellulose fibers, which are characterized by nitrogen–nitrogen double bonds (N=N azo bonds). Reactive dyes are chemically active, with very stable but harmful products, especially in powder form.7 Because of the vast harmful effects of the dye-polluted wastewater, it becomes very important to eliminate them from aqueous solution.
Many conventional methods for the removal of color and wastewater treatment have been discussed over the years, which include physical, chemical, and biological processes, elimination by oxidations,8−11 electrochemical method,12−14 adsorption,15−18 coagulation,16 membrane separation,19 and ion-exchange.20−22 Most of these methods however do not completely eliminate contaminants, they generate secondary contaminant byproducts, and are very expensive to operate. Among these technologies, adsorption is a common technique used for dye removal from aqueous solution because of its being relatively cost-effective, environmental friendly, and simple to operate.23,24 Several adsorbents such as Aspergillus fumigatusXC6,25 activated carbon,26 peanut,27 calcined Mg–Al-CO3,28 rosewood sawdust,29 sawdust and rice husk,30 calcined alunite31 as well as metal organic framework,32,33 and perlite34 had been reported for their abilities to adsorb dyes from contaminated wastewater.
Hydroxyapatite (HA) with chemical formula Ca10(PO4)6(OH)2 is an important inorganic material in the field of biology and chemistry.35 It is an excellent material with numerous biomedical applications, such as in artificial bone grafting, dental treatment, and drug delivery systems.36,37 Because of its excellent adsorption capacity and ionic exchange property, HA has been studied as an adsorbent for wastewater treatment, and its ability to remove heavy metal ions, fluorides, and dyes from aqueous solutions had been reported.38,39 Poultry eggs are consumed mostly as food and in food-related industries; it constitutes a waste when the shells are discarded. The shell is porous with high calcium content that can be explored for HA synthesis. This is expected to add values to this common agricultural waste and improve environment. This study reports the synthesis of HA with Ca derived from the poultry eggshell (PES); the synthesized poultry eggshell hydroxyapatite (PESHA) was characterized using scanning electron microscopy (SEM)/EDAX, transmission electron microscopy (TEM), Fourier transform infrared (FTIR), X-ray diffraction (XRD), and thermogravimetric analysis/differential thermal analysis. Application of synthesized PESHA as an adsorbent for the removal of Reactive Yellow 4 (RY4) from aqueous solution was investigated in a batch process; data obtained were subjected to various kinetics and isotherm models, whereas temperature-dependent adsorption data were analyzed for thermodynamics parameters.
2. Materials and Methods
2.1. Materials
Eggshells were sourced from a local poultry in Karaikudi, Tamil Nadu; ammonium dihydrogen phosphate (NH4)H2(PO4) (Riedel-de Haën, Germany), ammonia solution (EMSURE, ACS, reagents), and RY4 (BDH, London) were used. Other reagents were of Analar grade and were prepared with Milli-Q water.
2.2. Synthesis of Hydroxyapatite
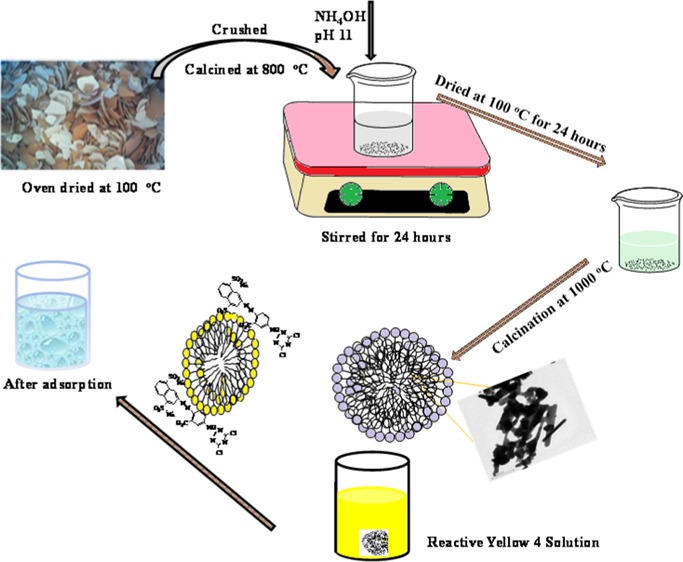
Eggshells were washed with distilled water and boiled for 30 min. After boiling, the samples were oven-dried at 100 °C overnight and crushed into smaller pieces, followed by three-stage calcination at 800 °C (at 5 °C min–1). A calculated amount of the calcined eggshell was dispersed in 500 mL of Milli-Q water in a 1000 mL conical flask and stirred for 30 min. The prepared 0.45 M ammonium dihydrogen phosphate (500 mL, (NH4)H2(PO4)) was added dropwise and stirred for about 30 min. The pH of the solution was adjusted using ammonia solution. The mixture was left for 24 h on the magnetic stirrer at room temperature for the formation of hydroxyapatite and thereafter filtered. The powder was dried in an oven at 100 °C for 12 h, and the solid particles formed were turned into powder, calcined at 1000 °C for 3 h, and labeled as poultry eggshell hydroxyapatite (PESHA).
2.3. Characterization of the Adsorbent
The crystal structure and crystallinity of the synthesized nanoparticle were characterized by XRD (X’Pert PRO, Netherland) using Cu Kα radiation (λ = 0.15406 nm) at 2θ = 10–60° with an incremental step size of 0.02. The crystallite size (D) of the sample was estimated using Debye–Scherrer’s equation,40 whereas the lattice parameters (a and c) were evaluated with Bragg reflection.41 Fourier transform infrared (FTIR) spectra of samples were recorded with KBr pellets in the range of 4000–400 cm–1 using FTIR spectroscopy (Bruker Optics, TENSOR 27 series). Au-sputtered samples were examined morphologically with SEM (Hitachi, Japan, S-3000H electron microscope with an accelerating voltage of 15 kV) equipped with EDAX. Transmission electron microscopy (TEM) images were obtained with a Tecnai model instrument (TEM; Tecnai 20 G2 FEI, Netherland). The pH at zero point charge (pHZPC) of the powder was determined using the method described by Ezechi et al.42 A surface area and pore size analyzer (A Quantachrome NOVA 2200C) was used in the analysis of surface area, pore volume, and pore size.
2.4. Adsorption Studies
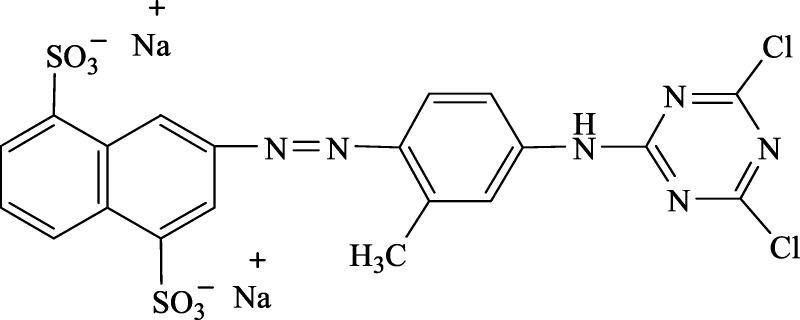
The RY4 dye used in this study is a disodium salt of 3-[[4-[(4,6-dichloro-1,3,5-triazin-2-yl)amino]-otolyl]azo]naphthalene-1,5-disulphonic acid, a Reactive Yellow 4, CI: 12226-45-8 (Figure 1). The adsorption experiments were conducted by adding different concentrations of the dye (40, 80, 120, 160, 200, and 240 mg L–1) in a 100 mL flask with predetermined amount of PESHA. The flasks were set on a temperature-controlled shaker with the agitation speed of 150 rpm. The samples were collected at different time intervals of 0, 5, 10, 15, 30, 60, 120, and 240 min, and the adsorbent was separated. The dye solution was adjusted to the desired pH value with aliquot of 1.0 M HCl or NaOH (Merck) prior to the adsorption study. The concentrations of the RY4 dye in the solutions were estimated using a spectrophotometer (UV–vis–NIR, VARIAN 500 Scan CARY).
Figure 1.
Reactive Yellow 4, CI: 12226-45-8.
Similarly, the isothermal study was performed in a set of 20 (100 mL) flasks, where 25 mL of different initial concentrations (10–100 mg L–1) at pH 7 in pairs, 10 of flasks were contacted with 10 mg of PESHA, whereas the remaining halves served as control. The solutions were kept in an isothermal shaker (30 ± 1 °C) for 24 h to attain equilibrium of the solid–solution mixture. The flasks were then removed from the shaker, and the final concentrations of dye in the solutions were determined. The amounts of dye removed at time t, Qt (mg g–1), and at equilibrium, Qe (mg g–1), were calculated using eqs 1 and 2, whereas percentage adsorption was calculated using eq 3
| 1 |
| 2 |
| 3 |
where Co (mg L–1) is the initial concentration, Ct (mg L–1) is the concentration of the dye at time t in the liquid phase, Ce (mg L–1) is the concentration of the dye at equilibrium in the liquid phase, V is the volume of the solution (L), W (g) is the mass of adsorbent, Abso is the blank absorbance, and Abse is the absorbance at equilibrium.
The mechanisms of the adsorption process were investigated using pseudo-first-order, pseudo-second-order, Elovich kinetics, and intraparticle diffusion models.43−46Equations 4 to 7 below were applied to describe the kinetics of adsorption of RY4 to PESHA.
| 4 |
| 5 |
| 6 |
| 7 |
where Qe (mg g–1) is the amount of RY4 adsorbed at equilibrium; k1 (min–1) and k2 (g mg–1 min–1) are the pseudo-first-order and -second-order rate constants, respectively; Kid (mg g–1 min–0.5) is the intraparticle diffusion constant; Ci (mg g–1) is a measure of thickness of the surface prior to the adsorption; and α and βel in the Elovich equation represent the initial adsorption rate (mg g–1 min–1) and the desorption constant (g mg–1), respectively.
Equilibrium data were analyzed with Langmuir, Freundlich, Tempkin, and Dubinin–Radushkevich (D–R) isotherm models (represented by eqs 8–11) for adsorption isothermal studies.47−50
| 8 |
| 9 |
| 10 |
| 11 |
where Qo (mg g–1) and b (L mg–1) are the Langmuir isotherm parameters related to the adsorption capacity and energy of adsorption, respectively. The separation factor (RL) expressed as RL = 1/(1 + bC0) provides important information about the nature of adsorption. The value of RL indicated whether the adsorption process is irreversible (RL = 0), favorable (0 < RL < 1), linear (RL = 1), or unfavorable (RL > 1). KF ((mol g–1)(mol L–1)−1/n) and n are Freundlich isotherm parameters characterizing the adsorption capacity and intensity. The Tempkin isotherm assumed a linear relationship between the heat of adsorption and coverage; the higher the heat of adsorption, the lower the surface coverage. aT and bT are the Tempkin parameters representing the equilibrium binding constant (L g–1) and heat of adsorption (J mol–1), respectively. However, the Dubinin–Radushkevic (D–R) isotherm model was applied for the adsorption process on homogeneous and heterogeneous surfaces. It was initially formulated for adsorption with a pore mechanism with assumption of surface inhomogeneity with adsorption energy distribution. Qs is the theoretical saturation capacity (mol g–1), β is a constant related to the mean free energy of adsorption per mole of the adsorbate (mol2 J–2), and ε (J mol–1) is the Polanyi potential given by relation ε = RT ln(1 + 1/Ce), R (J mol–1 K–1) is the gas constant, and T (K) is the absolute temperature of the equilibrium experiment. Constant β gives an idea about the mean free energy, E (kJ mol–1), of adsorption per molecule of the adsorbate when it is transferred to the surface of the solid from relationship E = (2β)−0.5. If the magnitude of E is between 8 and 16 kJ mol–1, the process is chemisorption, whereas values of E < 8 kJ mol–1 suggest a physical process.51
The effect of temperature on RY4 adsorption was investigated by evaluating the thermodynamic parameters, such as change in free energy (ΔG°), enthalpy (ΔH°), and entropy (ΔS°), of the adsorption system. The equilibrium constant, Ke, is related to the enthalpy and entropy change at a particular temperature by the van’t Hoff equation.52
| 12 |
where Ke is the equilibrium constant, which expresses the relationship between the amounts of RY4 dye adsorbed (Qe) in mg g–1 and the equilibrium concentration (Ce) in mg L–1. The expression for the equilibrium constant is Ke = Qe/Ce, whereas the free energy change of the adsorption reaction was estimated using expression ΔGθ = −RT In Ke
2.5. Statistical Test
The acceptability and the best fit of a model are mostly based on the square of the correlation coefficients, R2, which may be appropriate for linearized models. However, because the least-squares fit was employed for data fitting, there is need to compare error distribution because choosing an error function may be indispensable. Therefore, the sum square error (SSE) function (eq 13) was used to validate the fit kinetic models.
| 13 |
where N represents the number of data points. The higher the value of R2 and the lower the value of SSE, the more acceptable the model.
3. Results and Discussion
3.1. Characterization of PESHA
3.1.1. Morphological and Elemental Composition Investigations
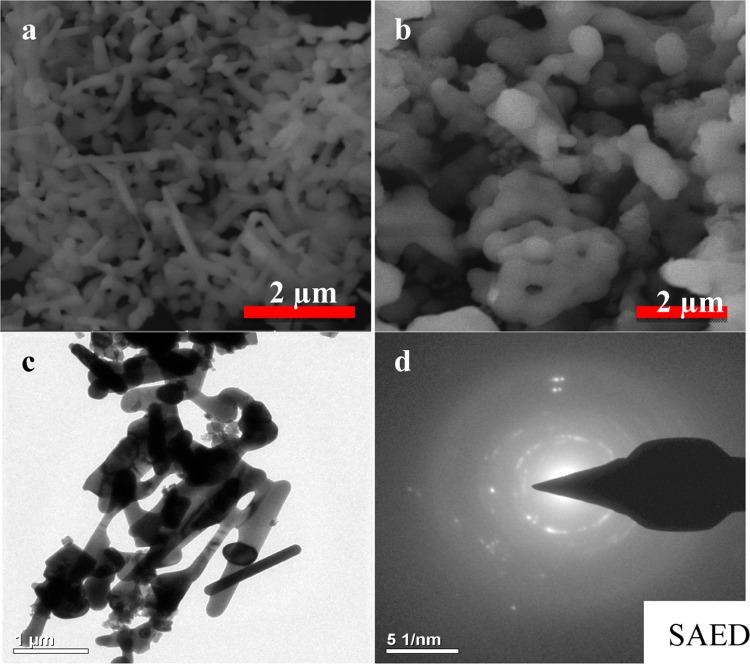
The morphologies of the PESHA powder synthesized at 1000 °C before and after the adsorption process are shown in Figure 2. The sample powder showed needle–rod-like structures, which latter changed to agglomerated particles upon adsorption of the RY4 dye. Careful analysis of TEM (Figure 2c) revealed that the particles are rod-shaped with the length of 15–60 nm and breath of 4–6 nm. Information from selected-area electron diffraction (SAED) revealed spotted and continuous rings, suggesting polycrystalline grains, as depicted in Figure 2d. Figure 3 illustrates the elemental composition of PESHA with distribution as shown in Table 1. The Ca/P ratio obtained was 1.63, indicating a nonstoichiometric apatite, which is due to the presence of the various trace elements in the apatite.
Figure 2.
SEM images of (a) PESHA before adsorption and (b) PESHA powder after adsorption and (c) TEM image and (d) SAED of PESHA.
Figure 3.
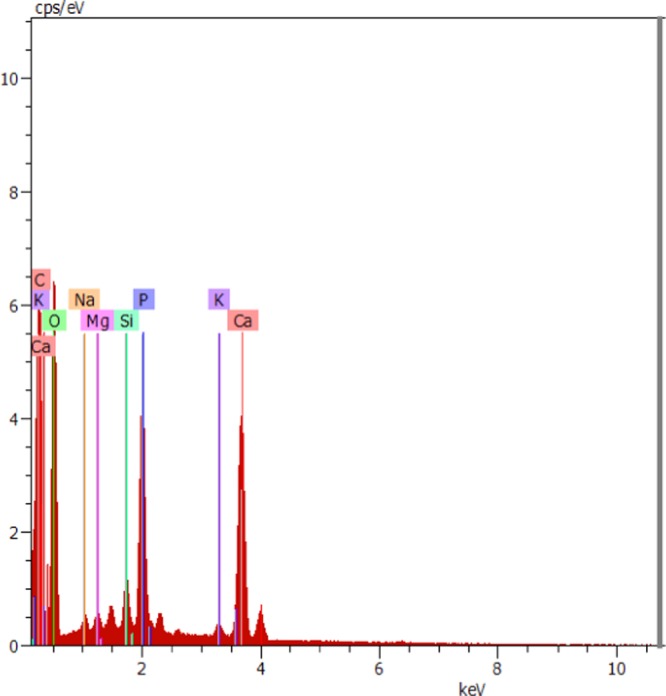
EDAX of PESHA.
Table 1. Elemental Composition of PESHA.
| elements | atom % | wt % |
|---|---|---|
| O | 64.90 | 54.61 |
| Ca | 9.72 | 20.48 |
| P | 5.94 | 9.68 |
| Mg | 0.62 | 0.79 |
| C | 15.99 | 10.10 |
| Si | 1.29 | 1.90 |
| K | 0.66 | 1.36 |
| Na | 0.89 | 1.07 |
3.1.2. FTIR Analysis
The FTIR spectra of the PESHA powder before and after adsorption are shown in Figure 4. The spectra show well-defined absorption bands in the range of 1040–567 cm–1, which is characteristic for the phosphate of the hydroxyapatite phase.53 The sharp peaks at 567 and 603 cm–1 are assigned to the bending mode (ν4) of O–P–O. Similarly, the bands observed in the range of 1643–3381 cm–1 in the as-synthesized PESHA samples confirm the presence of adsorbed H2O. However, the appearance of the bands between 3447 and 3577 cm–1 clearly represents the hydroxyl stretching mode associated with the OH group of the hydroxyapatite. The presence of the carbonate functional group was equally observed at 886, 1416, and 1472 cm–1. The FTIR spectra of the prepared PESHA powder after adsorption showed the basic vibration bands of PO4 groups of the apatite between 475–480, 560–570, and 1035–1108 cm–1. The peaks at 870 and 1460 cm–1 correspond to the ν2 and ν3 peaks of the carbonate functional group from the air. The broad bands in the regions of 1640 and 3530 cm–1 are attributed to OH– of adsorbed water molecules and the hydroxyl group, respectively. Shift in peak positions, broadening of peaks, and decrease in peak intensity were prominent after the adsorption process, indicating the adsorption of the RY4 dye onto the apatite surface, which took place through the major functional groups (phosphate, carbonate, and hydroxyl groups).
Figure 4.
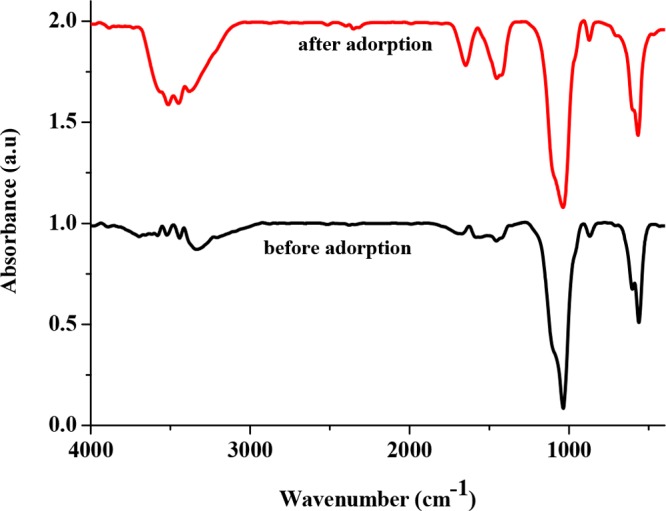
FTIR spectra of PESHA before and after adsorption
3.1.3. XRD Study
The XRD patterns of PESHA before and after adsorption are presented in Figure 5. The major peaks observed were compared with the JCPDS standard data (ref code: 09-0432) for the HA powder (HAp). Good agreement between the data obtained from the XRD diffraction pattern of PESHA and JCPDS standard for hydroxyapatite affirms the HA powder fabricated from eggshells. Particularly, the strong diffraction peaks at 2θ positions 25.96 and 31.768° corresponding to the (002) and (211) planes of HA were detected in PESHA. The appearance of many sharp peaks suggests the formation of a crystalline structure. Upon adsorption of the RY4 dye, there was no appearance of a second phase, thus suggesting the phase purity and stability of the apatite. However, significant broadening in the XRD diffraction peaks as well as decrease in peak intensity were observed after the adsorption process, suggesting the incorporation of RY4 dye into the apatite lattice. The lattice defects caused by the adsorption of RY4 dye onto the structure of PESHA were evaluated further by computing the unit cell parameters (a and c) and the unit cell volumes (V), and their values are presented in Table 2. The lattice parameters were very close to the standard JCPDS no. 09-432 for the HAp. Both parameters were smaller than the standard value for HAp. Whereas lattice parameter “a” decreases on adsorption of the RY4 dye onto the apatite structure, lattice parameter “c” and unit cell volume “V” increase after adsorption. The crystallite size decreases from 86.32 to 51.61 nm after the adsorption of the dye, which corroborated the results from XRD and FTIR analyses.
Figure 5.
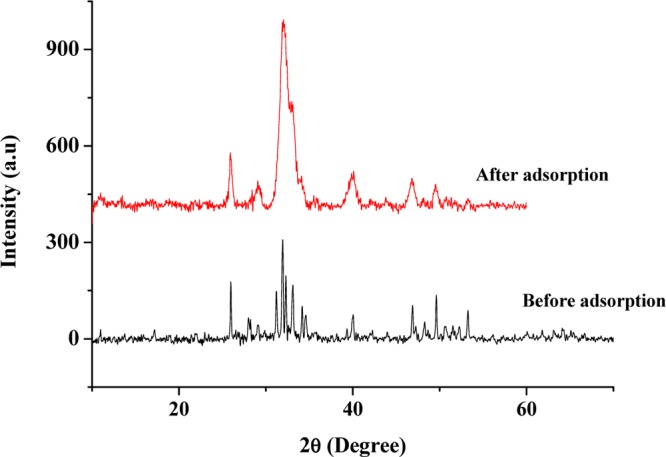
XRD patterns of synthesized HA from eggshell before and after adsorption.
Table 2. Lattice Parameters of the PESHA Powder.
| parameter |
||||||
|---|---|---|---|---|---|---|
| samples | FWHM (deg) | a (nm) | c (nm) | c/a | V (nm) | crystallite size (nm) |
| HAp (JCPDS no. 09-432) | 0.9418 | 0.6884 | 0.73094 | 1.5808 | ||
| PWEHA | 0.19324 | 0.9413 | 0.6881 | 0.7310 | 1.5816 | 86.32 |
| PWEHA + RY4 | 0.10138 | 0.9414 | 0.6895 | 0.7324 | 1.5819 | 51.61 |
The physicochemical properties of the synthesized PESHA powder were evaluated, and the results are presented in Table 3. This is essential because the surface charge, surface area, and pore size affect the interaction of the adsorbent with the adsorbate. The particle size affects the contact area and the packing characteristics of the materials and hence the macroporosity of the particle. The surface area, average pore size, pore volume, and bulky density are within the range reported in the literature.54,55 The pHZPC obtained indicates that the sample has a slightly negatively charged surface.56
Table 3. Physicochemical Properties of the Synthesized Hydroxyapatite Powder.
| parameters | PESHA |
|---|---|
| surface area (m2 g–1) | 89.36 |
| average pore size (nm) | 1.73 |
| pore volume (cm2 g–1) | 0.36 |
| bulky density (g cm–2) | 2.16 |
| ash content (%) | 2.14 |
| pHZPC | 6.84 |
3.2. Adsorption Studies
3.2.1. Effect of Contact Time and Initial RY4 Dye Concentration on the Adsorption Process
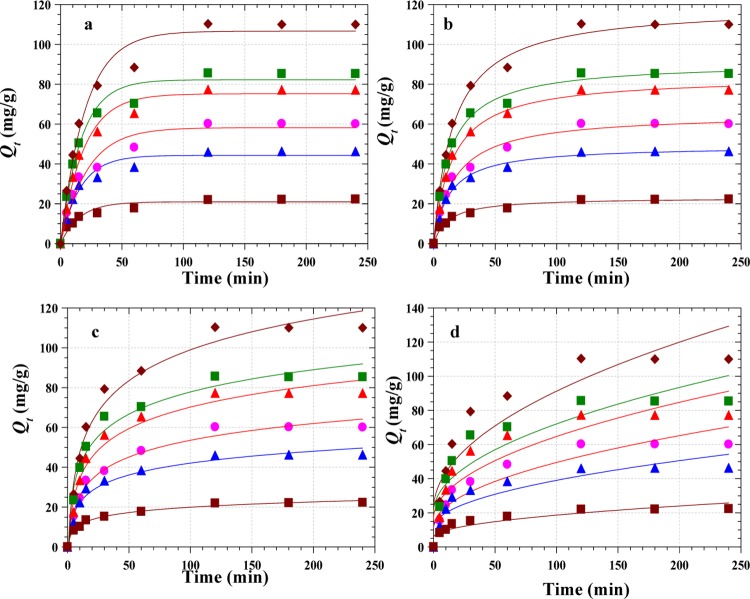
Adsorption of RY4 onto the PESHA powder at different contact times and initial dye concentrations was evaluated, and the results are presented in Figure 6. It could be deduced from Figure 6 that adsorption of RY4 onto PESHA is time- and initial RY4 concentration-dependent. It was observed that as the contact time and initial concentration of RY4 increase, the amount of RY4 dye adsorbed on the surface of PESHA increases rapidly for the first 20 min of the process, followed by a gradual increase in the adsorption rate, until equilibrium was reached after 120 min. The amount of RY4 adsorbed increases from 8.3 to 110.3 mg g–1 as the initial dye concentration increases from 40 and 240 mg L–1. These observations may be attributed to the rapid saturation of the adsorbent’s surface by dye molecules, because of which it becomes increasingly more difficult for the dye molecules to find available vacant sites and, as such, no significant adsorption was observed after equilibrium.57
Figure 6.
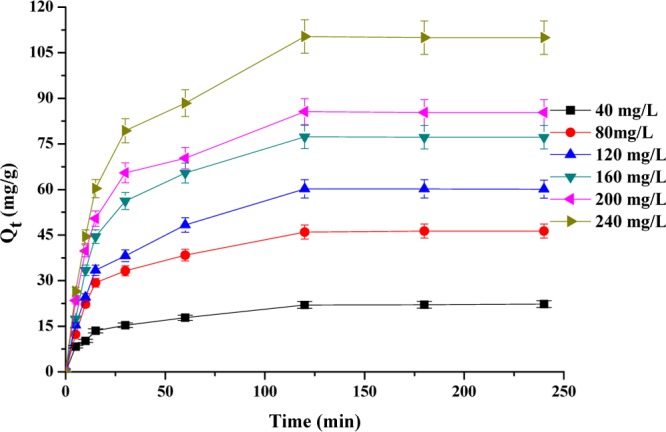
Effect of contact time and initial dye concentration on the adsorption process.
3.2.2. Effect of Adsorbent Dosage on the Adsorption of RY4
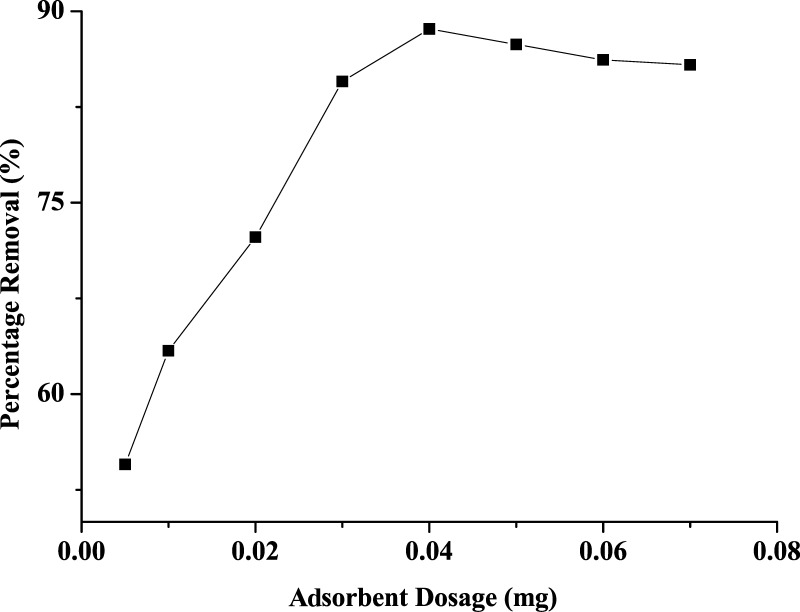
Figure 7 represents the effect of varying amount of the adsorbent on the adsorption of RY4 dye from aqueous solution. The results showed that the amount of the dye adsorbed increases from 63.4 to 88.6% as the adsorbent dosage increases from 0.01 to 0.04 g, above which there was no appreciable increase in the amount of the dye removed from the solution, and as such, a mass of 0.04 g was utilized for subsequent studies. The increase in adsorption as the dosage increases could be attributed to the availability of vacant sites as the adsorbent quantity increases; however, at a higher quantity, the agglomeration of the particles affected the surface area, which led to insignificant increase in adsorption capacity at a high adsorbent dosage.58
Figure 7.
Effect of adsorbent dosage on removal of RY4 dye from aqueous.
3.2.3. Effect of pH on the Adsorption of RY4 Dye
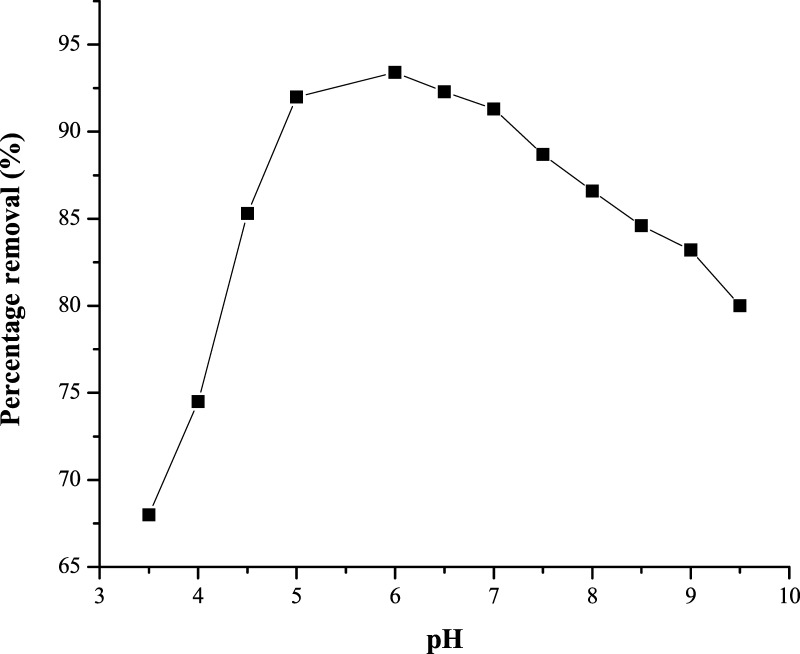
One of the most important factors that influence the adsorption process is pH; this is due to the fact that both adsorbed molecules and adsorbent particles may have functional groups that can be affected by the concentration of hydrogen ions (H+).59 The pH at zero point charge (pHZPC) of PESHA was estimated to be 6.84, as shown in Table 3. The implication is that above this value the surface of PESHA becomes negatively charged because the RY4 dye is anionic, lower pH, i.e., an acidic medium should favor the adsorption of the dye due to the electrostatic interaction between the adsorbent and adsorbate. Figure 8 shows the effect of pH on the removal of RY4 from aqueous solution; the highest percentage removal of 93.4% was achieved at a pH of 6.0, suggesting that the positive form of the adsorbent was responsible for the adsorption of RY4 in the negative form. The decrease in the percentage removal of RY4 dye at pH <6.0 may be attributed to the formation of H bonds between the dye molecule and the available H+, whereas the decrease at higher pH values may be a result of the repulsive electrostatic forces existing between the negatively charged surface of the adsorbent and that of the RY4.60
Figure 8.
Effect of pH on the removal of RY4 dye.
3.3. Adsorption Kinetics Modeling
Understanding the kinetics of the adsorption process is necessary to elucidate the full-scale optimum conditions. Figure 9a–d gives the plots of four different kinetic models (eqs 4–7) employed to analyze the time-dependent adsorption of RY4 by PESHA. Figure 9b corresponding to the pseudo-second-order kinetics appeared to be best fit with the data, which is also in agreement with the values of R2 obtained, as shown in Table 4. However, the pseudo-first-order fit (Figure 9a) was adjudged as the best fit because the values of Qe obtained (Qe calc) are consistent with the experimental values (Qe exp) and, in addition, the %SSE in pseudo-first order is lower when compared with second-order parameters. The Elovich model’s parameters showed an increase in the adsorption rate as the initial concentration of the dye increases, as shown by the values of α (adsorption rate); this results from the increased concentration gradient across the surface, and the decrease in desorption rate (β) with the increased initial concentration could be attributed to the formation of chemical bonds between the dye and functional groups present on PESHA.
Figure 9.
Kinetic fits for the adsorption of RY4 dye on PESHA (a) pseudo-first order model fits (b) pseudo-second order model fits (c) Elovich and (d) Intraparticle diffusion model fits. (Temp: 30 °C, pH: 7.0 and adsorbent dosage: 0.4 g/L).
Table 4. Kinetic Parameters for the Adsorption of RY4 by PESHA.
| Co (mg L–1) | 40 | 80 | 120 | 160 | 200 | 240 | |
|---|---|---|---|---|---|---|---|
| Qe exp (mg g–1) | 22.3 | 46.3 | 60.1 | 77.2 | 85.3 | 110 | |
| first-order | Qe cal (mg g–1) | 21.0 | 44.3 | 58.2 | 75.2 | 82.2 | 106.6 |
| k1 × 102 (min–1) | 0.064 | 0.062 | 0.046 | 0.053 | 0.060 | 0.050 | |
| R2 | 0.989 | 0.994 | 0.993 | 0.997 | 0.996 | 0.996 | |
| %SSE | 0.45 | 0.67 | 0.63 | 0.67 | 1.02 | 1.12 | |
| second-order | Qe cal (mg g–1) | 23.1 | 49.1 | 65.2 | 83.9 | 91.1 | 119.5 |
| k2 × 104 (g mg–1 min–1) | 36.74 | 16.22 | 9.03 | 7.89 | 8.46 | 5.16 | |
| R2 | 0.997 | 0.998 | 0.998 | 0.999 | 0.999 | 0.999 | |
| %SSE | 0.24 | 0.83 | 1.53 | 2.03 | 1.76 | 2.87 | |
| Elovich | α (mg g–1 min–1) | 6.81 | 11.42 | 10.03 | 14.18 | 20.34 | 18.75 |
| β × 102 (g mg–1) | 25.95 | 11.62 | 8.25 | 6.43 | 6.22 | 4.48 | |
| R2 | 0.998 | 0.995 | 0.997 | 0.995 | 0.995 | 0.996 | |
| %SSE | 0.30 | 1.00 | 1.23 | 2.00 | 1.99 | 2.56 | |
| intraparticle diffusion | Kid (mg g–1 min–0.5) | 1.32 | 2.80 | 3.83 | 4.86 | 5.20 | 6.99 |
| C1 (mg g–1) | 5.40 | 10.86 | 11.02 | 15.81 | 19.79 | 21.02 | |
| R2 | 0.971 | 0.964 | 0.973 | 0.964 | 0.964 | 0.968 | |
| %SSE | 1.04 | 2.40 | 3.08 | 4.23 | 4.55 | 5.82 |
The intraparticulate diffusion model was used to investigate the mechanisms of the adsorption process. The increase in Kid values noted as the initial concentration of the dye increases is a result of resistance of the surface boundary to the increased driving force with the concentration gradient across the adsorbent surface. The values of the intercepts, C1, obtained showed that the initial stage of adsorption was characterized by both the intraparticle diffusion and external mass transfer, with the latter playing a significant role.61
3.4. Adsorption Isotherms
The adsorption isotherm relates the amount of a substance adsorbed onto the solid phase of adsorbent to the concentration of the substance in bulk solution at equilibrium at a particular temperature.62Figure 10 shows the plots of four different isotherm models (eqs 8–11) used to analyze the equilibrium data obtained in this study. The parameters obtained from the least-squares fits of the models are shown in Table 5. The Langmuir isotherm model gives the best fit with the maximum adsorption capacity of 127.91 mg g–1, with the value of RL of 0.04, suggesting a favorable adsorption of RY4 by PESHA. The Freundlich isotherm parameter n > 1 also implied a favorable adsorption process moderate heat of adsorption and the binding energy obtained from the Tempkin isotherm suggested favorable interactions between the dye and adsorbent molecules. The Dubinin–Radushkevich model gave a theoretical adsorption capacity, Qs, of 84.29 mg g–1 with the maximum adsorption energy E of 0.24 kJ mol–1, suggesting a physisorption adsorption process. The overall comparison of the isotherms using the average values of R2 shows that the isotherm fits are in the order Langmuir > Tempkin > Freundlich isotherm > Dubinin–Radushkevich. Table 6 shows that PESHA compared favorably with other synthetic and modified adsorbents for reactive dye removal.
Figure 10.
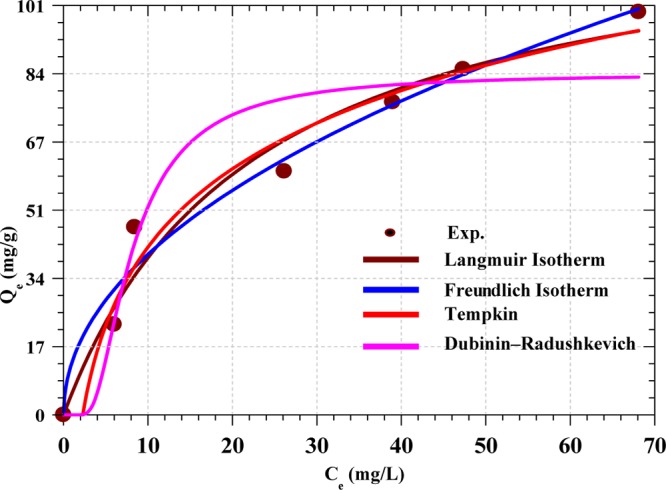
Isotherm fits for the adsorption of RY4 dye by PESHA (Initial dye conc: 10−100 mg/L, Temp: 30 °C, pH: 7.0 and adsorbent dosage: 0.4 g/L).
Table 5. Isotherm Parameters for the Adsorption of RY4 by PESHA.
| isotherm | parameters | values |
|---|---|---|
| Langmuir | Qo (mg g–1) | 125.98 |
| b (L mg–1) | 0.04 | |
| RL | 0.17 | |
| R2 | 0.994 | |
| Freundlich | KF ((mol g–1)(mol L–1)−1/n) | 13.01 |
| n | 2.07 | |
| R2 | 0.992 | |
| Tempkin | aT (L mg–1) | 90.51 |
| bT | 0.44 | |
| R2 | 0.993 | |
| Dubinin–Radushkevich | Qs (mg g–1) | 84.29 |
| β × 106 (mol J–1)2 | 8.59 | |
| E (kJ mol–1) | 0.24 | |
| R2 | 0.978 |
Table 6. Comparison of Various Adsorbents with PESHA for the Removal of the Reactive Dye from Aqueous Media.
| adsorbent | adsorption capacity (mg g–1) | reference |
|---|---|---|
| apatitic octocalcium phosphate | 61.65 | El-Boujaady et al., 2011 |
| apatitic tricalcium phosphate | 40.85 | El-Boujaady et al., 2011 |
| calcium deficient hydroxyapatite | 51.08 | El-Boujaady et al., 2016 |
| chitosan | 133.28 | Karmaker et al., 2015 |
| chitosan coated magnetite nanoparticles | 47.62 | Kalkan et al., 2012 |
| hydroxyapatite | 50.25 | Barka et al.57 |
| poultry eggshell derived apatite | 127.9 | this study |
3.5. Thermodynamic Studies on RY4 Dye Adsorption
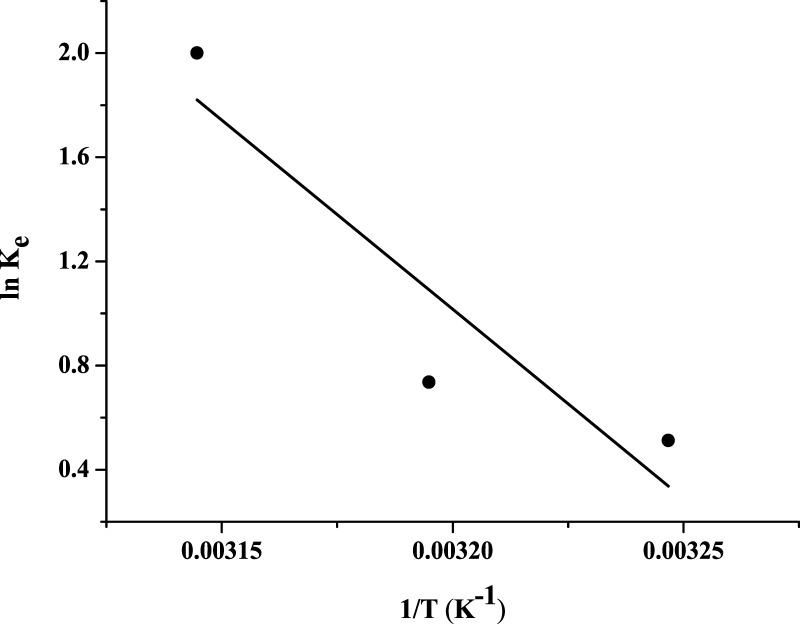
The van’t Hoff linear plot of ln Ke versus 1/T is shown in Figure 11, and the thermodynamic parameters are presented in Table 7. From the tables, the negative value of ΔG indicates that the adsorption process is spontaneous in nature, whereas the positive value of enthalpy change indicates that the adsorption process is endothermic in nature.63 The values of ΔH and ΔS obtained show that the adsorption of RY4 onto PESHA can be controlled by the entropic effect rather than the enthalpy change.64
Figure 11.
Plot of ln Ke vs 1/T for for Adsorption of RY4 by PESHA.
Table 7. Thermodynamic Parameters for the Adsorption of RY4 onto PESHA.
| T (K) | Ke | ΔG (kJ mol–1) | ΔH (kJ mol–1) | ΔS (kJ mol–1 K–1) | R2 |
|---|---|---|---|---|---|
| 308 | 1.67 | –1.31 | 120.79 | 0.395 | 0.853 |
| 313 | 2.09 | –1.92 | |||
| 318 | 7.40 | –5.29 |
4. Conclusions
This research work investigated a clean, nontoxic, and ecofriendly method for the synthesis of hydroxyapatite from poultry waste of eggshell for the removal of RY4 dye from aqueous solution. The efficiency of biomass material for the adsorption of RY4 dye was found to be dependent on the reaction contact time, initial dye concentration, biomass concentration, temperature, and the solution pH of the medium. FTIR results showed that the adsorption of the adsorbent by the biomass was due to the presence of the negative phosphate, carbonate, and hydroxyl functional groups along its chains. High values of the correlation coefficients of Langmuir, Freundlich, Tempkin, and Dubinin–Radushkevich obtained inferred that all of the isotherms tested positive for the adsorption of RY4 dye by the PESHA powder; however, the Freundlich isotherm best described the adsorption process. Kinetic studies carried out indicated that the pseudo-first-order kinetic model best described the adsorption mechanism. Furthermore, the thermodynamic studies revealed that the adsorption process was exothermic and spontaneous in nature. Thus, poultry waste of eggshell can be effectively utilized for the fabrication of important adsorbents, which can be deployed in the removal of dyes from wastewater.
Acknowledgments
Authors wish to acknowledge financial support received from the Department of Science and Technology, Government of India, for RTF-DCS (DST) fellowship awarded to E.A.O. to enable him carried out the research work. Authors equally thank the technical staff of the Central Instrumentation Facility (CIF) of CSIR, Central Electrochemical Research Institute, Indian, for their support during the analysis of the results.
Glossary
Abbreviations
- Ce
equilibrium concentration of RY4 in solution (mg L–1)
- C0
initial RY4 concentration (mg L–1)
- Ct
RY4 concentration at time t (mg L–1)
- D–R
Dubinin–Radushkevich
- FTIR
Fourier transformed infrared
- k1
first-order rate constant (min–1)
- k2
second-order rate constant (g mg–1 min–1)
- KF
Freundlich constant
- Kid
intraparticle diffusion constant
- PESHA
poultry eggshell hydroxyapatite
- %SSE
percentage statistical error
- Qe
amount of dye removed at equilibrium (mg g–1)
- Qo
maximum adsorption capacity (mg g–1)
- Qt
amount of dye removed at any time (mg g–1)
- R
gas constant (J mol–1 K–1)
- R2
correlation coefficient
- RL
Langmuir constant
- RY4
Reactive Yellow 4
- SEM
scanning electron microscopy
- XRD
X-ray diffraction
- ΔG°
Gibbs free energy change (kJ mol–1)
- ΔH°
enthalpy change (kJ mol–1)
- ΔS°
entropy change (kJ mol–1 K–1)
The authors declare no competing financial interest.
References
- Crini G. Non-conventional low-cost adsorbents for dye removal: A review. Bioresour. Technol. 2006, 97, 1061–1085. 10.1016/j.biortech.2005.05.001. [DOI] [PubMed] [Google Scholar]
- Rajagopalan S.Water Pollution Problem in Textile Industry and Control. In Pollution Management in Industries; Trivedy R. K., Ed.; Environmental Pollution: Karadudi, India, 1995; pp 21–44. [Google Scholar]
- Routh T. Anaerobic Treatment of vegetable tannery wastewater by UASB process. Indian J. Environ. Prot. 1998, 20, 115–123. [Google Scholar]
- Kolpin D. W.; Furlong E. T.; Meyer M. T.; Thurman E. M.; Zaugg S. D.; Barber L. B.; Buxton H. T. Pharmaceuticals, hormones and other organic wastewater contaminants in US streams, 1999–2000: a national reconnaissance. Environ. Sci. Technol. 2000, 36, 1202–1211. 10.1021/es011055j. [DOI] [PubMed] [Google Scholar]
- Ali M.; Sreekrishnan T. R. Aquatic toxicity from pulp and paper mill effluents-a review. Adv. Environ. Res. 2001, 5, 175–196. 10.1016/S1093-0191(00)00055-1. [DOI] [Google Scholar]
- Sun Q.; Yang L. The adsorption of basic dyes from aqueous solution on modified peat-resin particle. Water Res. 2003, 37, 1535–1544. 10.1016/S0043-1354(02)00520-1. [DOI] [PubMed] [Google Scholar]
- Shawabkeh R. A.; Tutunji M. F. Experimental study and modeling of basic dye sorption by diatomaceous clay. App. Clay Sci. 2003, 24, 111–120. 10.1016/S0169-1317(03)00154-6. [DOI] [Google Scholar]
- Saleh T. A.; Gupta V. K. Functionalization of tungsten oxide into MWCNT and its application for sunlight-induced degradation of rhodamine B. J. Colloid Interface Sci. 2011, 362, 337–344. 10.1016/j.jcis.2011.06.081. [DOI] [PubMed] [Google Scholar]
- Saleh T. A.; Gupta V. K. Photo-catalyzed degradation of hazardous dye methyl orange by use of a composite catalyst consisting of multi-walled carbon nanotubes and titanium dioxide. J. Colloid Interface Sci. 2012, 371, 101–106. 10.1016/j.jcis.2011.12.038. [DOI] [PubMed] [Google Scholar]
- Saravanan R.; Karthikeyan S.; Gupta V. K.; Sekaran G.; Narayanan V.; Stephen A. Enhanced photocatalytic activity of ZnO/CuO nanocomposite for the degradation of textile dye on visible light illumination. Mater. Sci. Eng., C 2013, 33, 91–98. 10.1016/j.msec.2012.08.011. [DOI] [PubMed] [Google Scholar]
- Saravanan R.; Gracia F.; Khan M. M.; Poornima V.; Gupta V. K.; Narayanan V.; Stephen A. ZnO/CdO nanocomposites for textile effluent degradation and electrochemical detection. J. Mol. Liq. 2015, 209, 374–380. 10.1016/j.molliq.2015.05.040. [DOI] [Google Scholar]
- Rajendran S.; Khan M. M.; Gracia F.; Qin J.; Gupta V. K.; Arumainathan S. Ce3+-ion-induced visible-light photocatalytic degradation and electrochemical activity of ZnO/CeO2 nanocomposite. Sci. Rep. 2016, 6, 31641 10.1038/srep31641. [DOI] [PMC free article] [PubMed] [Google Scholar]
- Adeogun A. I.; Babu B. R. Kinetics, isothermal and thermodynamics studies of electrocoagulation removal of basic dye rhodamine B from aqueous solution using steel electrodes. Appl. Water Sci. 2015, 5, 1–13. 10.1007/s13201-015-0337-4. [DOI] [Google Scholar]
- Valero D.; Ortiz J. M.; Expósito E.; Montiel V.; Aldaz A. Electrochemical wastewater treatment directly powered by photovoltaic panels: electrooxidation of a dye-containing wastewater. Environ. Sci. Technol. 2010, 44, 5182–5187. 10.1021/es100555z. [DOI] [PubMed] [Google Scholar]
- Jain A. K.; Gupta V. K.; Bhatnagar A.; Suhas A. Comparative study of adsorbents prepared from industrial wastes for removal of dyes. Sep. Sci. Technol. 2003, 38, 463–481. 10.1081/SS-120016585. [DOI] [Google Scholar]
- Gupta V. K.; Ali I.; Saleh T. A.; Nayak A.; Agarwal S. Chemical treatment technologies for waste-water recycling-an overview. RSC Adv. 2012, 6380–6388. 10.1039/c2ra20340e. [DOI] [Google Scholar]
- Mittal A.; Mittal J.; Malviya A.; Gupta V. K. Adsorptive removal of hazardous anionic dye “Congo red” from wastewater using waste materials and recovery by desorption. J. Colloid Interface Sci. 2009, 340, 16–26. 10.1016/j.jcis.2009.08.019. [DOI] [PubMed] [Google Scholar]
- Mittal A.; Mittal J.; Malviya A.; Kaur D.; Gupta V. K. Decoloration treatment of a hazardous triarylmethane dye, Light Green SF (Yellowish) by waste material adsorbents. J. Colloid Interface Sci. 2010, 342, 518–527. 10.1016/j.jcis.2009.10.046. [DOI] [PubMed] [Google Scholar]
- Gupta V. K.; Ali I.. Adsorbents for Water Treatment: Development of Low-Cost Alternatives to Carbon. Encyclopedia of Surface and Colloid Science; Somasundaran P., Ed.; Marcel Dekker: NY, 2003; p 1. [Google Scholar]
- Lin G. H.; Brusick D. J. Mutagenicity studies on two triphenylmethane dyes, bromophenol blue and tetrabromophenol blue. J. Appl. Toxicol. 1992, 12, 267–274. 10.1002/jat.2550120410. [DOI] [PubMed] [Google Scholar]
- Carneiro P. A.; Osugi M. E.; Fugivar C. S.; Boralle N.; Furlan M.; Zanoni M. V. B. Evaluation of different electrochemical methods on the oxidation and degradation of Reactive Blue 4 in aqueous solution. Chemosphere 2005, 59, 431–439. 10.1016/j.chemosphere.2004.10.043. [DOI] [PubMed] [Google Scholar]
- Zucca P.; Vinci C.; Sollai F.; Rescigno A.; Sanjust E. Degradation of Alizarin Red S under mild experimental conditions by immobilized 5,10,15,20-tetrakis(4-sulfonatophenyl) porphine-Mn(III) as a biomimetic peroxidase-like catalyst. J. Mol. Catal. A: Chem. 2008, 288, 97–102. 10.1016/j.molcata.2008.04.001. [DOI] [Google Scholar]
- Panizza M.; Michaud P. A.; Cerisola G.; Comninellis C. Electrochemical treatment of wastewaters containing organic pollutants on boron-doped diamond electrodes: prediction of specific energy consumption and required electrode area. Electrochem. Commun. 2001, 3, 336–339. 10.1016/S1388-2481(01)00166-7. [DOI] [Google Scholar]
- Wang Z.; Xu X.; Gong Z.; Yang F. Removal of COD phenols and ammonium from Lurgi coal gasification wastewater using A2O-MBR system. J. Hazard. Mater. 2012, 235–236, 78–84. 10.1016/j.jhazmat.2012.07.012. [DOI] [PubMed] [Google Scholar]
- Jin X. C.; Liu G. Q.; Xu Z. H.; Tao W. Y. Decolorization of a dye industry effluent by Aspergillus fumigatus XC6. Appl. Microbiol. Biotechnol. 2007, 74, 239–243. 10.1007/s00253-006-0658-1. [DOI] [PubMed] [Google Scholar]
- Kalathil S.; Lee J.; Cho M. H. Granular activated carbon based microbial fuel cell for simultaneous decolorization of real dye wastewater and electricity generation. New Biotechnol. 2011, 29, 32–37. 10.1016/j.nbt.2011.04.014. [DOI] [PubMed] [Google Scholar]
- Tanyildizi M. Ş. Modeling of adsorption isotherms and kinetics of reactive dye from aqueous solution by peanut hull. Chem. Eng. J. 2011, 168, 1234–1240. 10.1016/j.cej.2011.02.021. [DOI] [Google Scholar]
- El Gaini L.; Lakraimi M.; Sebbar E.; Meghea A.; Bakasse M. Removal of indigo carmine dye from water to Mg-Al-CO3-calcined layered double hydroxides. J. Hazard. Mater. 2009, 161, 627–632. 10.1016/j.jhazmat.2008.04.089. [DOI] [PubMed] [Google Scholar]
- Garg V. K.; Amita M.; Kumar R.; Gupta R. Basic dye (methylene blue) removal from simulated wastewater by adsorption using Indian Rosewood sawdust: a timber industry waste. Dyes Pigm. 2004, 63, 243–250. 10.1016/j.dyepig.2004.03.005. [DOI] [Google Scholar]
- Daud N. K.; Hameed B. H. Decolorization of Acid Red 1 by Fenton-like process using rice husk ash-based catalyst. J. Hazard. Mater. 2010, 176, 938–944. 10.1016/j.jhazmat.2009.11.130. [DOI] [PubMed] [Google Scholar]
- Tunali S.; Özcan A. S.; Özcan A.; Gedikbey T. Kinetics and equilibrium studies for the adsorption of Acid Red 57 from aqueous solutions onto calcined-alunite. J. Hazard. Mater. 2006, 135, 141–148. 10.1016/j.jhazmat.2005.11.033. [DOI] [PubMed] [Google Scholar]
- Alqadami A. A.; Naushad M.; Abdalla M. A.; Khan M. R.; Alothman Z. A. Adsorptive removal of toxic dye using Fe3O4-TSC nanocomposite: equilibrium, kinetic, and thermodynamic studies. J. Chem. Eng. Data 2016, 61, 3806–3813. 10.1021/acs.jced.6b00446. [DOI] [Google Scholar]
- Alqadami A. A.; Naushad M.; Alothman Z. A.; Ghfar A. A. Novel Metal-Organic Framework (MOF) Based Composite Material for the Sequestration of U (VI) and Th (IV) Metal Ions from Aqueous Environment. ACS Appl. Mater. Interfaces 2017, 36026–36037. 10.1021/acsami.7b10768. [DOI] [PubMed] [Google Scholar]
- Koparal A. S.; Yavuz Y.; Bakir Öğütveren Ü. Electroadsorption of Acilan Blau dye from textile effluents by using activated carbon-perlite mixtures. Water Environ. Res. 2002, 74, 521–525. 10.2175/106143002X140314. [DOI] [PubMed] [Google Scholar]
- Sarikaya M.; Tamerler C.; Jen A. K. Y.; Schulten K.; Baneyx F. Molecular biomimetics: nanotechnology through biology. Nat. Mater. 2003, 2, 577. 10.1038/nmat964. [DOI] [PubMed] [Google Scholar]
- Saito N.; Murakami N.; Takahashi J.; Horiuchi H.; Ota H.; Kato H.; Okada T.; Nozaki K.; Takaoka K. Synthetic biodegradable polymers as drug delivery systems for bone morphogenetic proteins. Adv. Drug Delivery Rev. 2005, 57, 1037–1048. 10.1016/j.addr.2004.12.016. [DOI] [PubMed] [Google Scholar]
- Sopyan I.; Mel M.; Ramesh S.; Khalid K. A. Porous hydroxyapatite for artificial bone applications. Sci. Technol. Adv. Mater. 2007, 8, 116–123. 10.1016/j.stam.2006.11.017. [DOI] [Google Scholar]
- Feng Y.; Gong J. L.; Zeng G. M.; Niu Q. Y.; Zhang H. Y.; Niu C. G.; Deng J. H.; Yan M. Adsorption of Cd(II) and Zn(II) from aqueous solutions using magnetic hydroxyapatite nanoparticles as adsorbents. Chem. Eng. J. 2010, 162, 487–494. 10.1016/j.cej.2010.05.049. [DOI] [Google Scholar]
- Adeogun A. I.; Babu R. B. One-step synthesized calcium phosphate-based material for the removal of alizarin S dye from aqueous solutions: isothermal, kinetics, and thermodynamics studies. Appl. Nanosci. 2015, 1–13. 10.1007/s13204-015-0484-9. [DOI] [Google Scholar]
- Uskoković V.; Desai T. A. In vitro analysis of nanoparticulate hydroxyapatite/chitosan composites as potential drug delivery platforms for the sustained release of antibiotics in the treatment of osteomyelitis. J. Pharm. Sci. 2014, 103, 567–579. 10.1002/jps.23824. [DOI] [PMC free article] [PubMed] [Google Scholar]
- Murugan R.; Ramakrishna S. Bioresorbable composite bone paste using polysaccharide based nano hydroxyapatite. Biomaterials 2004, 25, 3829–3835. 10.1016/j.biomaterials.2003.10.016. [DOI] [PubMed] [Google Scholar]
- Ezechi E. H.; bin Mohamed Kutty S. R.; Malakahmad A.; Isa M. H. Characterization and optimization of effluent dye removal using a new low cost adsorbent: equilibrium, kinetics and thermodynamic study. Process Saf. Environ. Prot. 2015, 98, 16–32. 10.1016/j.psep.2015.06.006. [DOI] [Google Scholar]
- Lagergren S.Zur Theorie der Sogenannten Adsorption Geloster Stoffe; Kungliga svenska vetenskapsakademiens: Handlingar, 1898; Vol. 24, pp 1–39. [Google Scholar]
- Ho Y. S. Review of second-order models for adsorption systems. J. Hazard. Mater. 2006, 136, 681–689. 10.1016/j.jhazmat.2005.12.043. [DOI] [PubMed] [Google Scholar]
- Gimbert F.; Mench M.; Coeurdassier M.; Badot P. M.; Vaufleury A. Kinetic and dynamic aspects of soil-plant-snail transfer of cadmium in the field. Environ. Pollut. 2008, 152, 736–745. 10.1016/j.envpol.2007.06.044. [DOI] [PubMed] [Google Scholar]
- Plazinski W.; Rudzinski W.; Plazinska A. Theoretical models of sorption kinetics including a surface reaction mechanism: A review. Adv. Colloid Interface Sci. 2009, 152, 2–13. 10.1016/j.cis.2009.07.009. [DOI] [PubMed] [Google Scholar]
- Freundlich H. M. F. Over the adsorption in solution. J. Phys. Chem. 1906, 57, 385–471. [Google Scholar]
- Langmuir I. The constitution and fundamental properties of solids and liquids. J. Am. Chem. Soc. 1916, 38, 2221–2295. 10.1021/ja02268a002. [DOI] [Google Scholar]
- Temkin M. I.; Pyzhev V. Kinetics of Ammonia Synthesis on Promoted Iron Catalyst. Acta Physiochim. URSS 1940, 12, 217–222. [Google Scholar]
- Dubinin M. M.; Radushkevich L. V. The equation of the characteristic curve of the activated charcoal. Proc. Acad. Sci. USSR, Phys. Chem. Sect 1947, 55, 331–337. [Google Scholar]
- Vahidhabanu S.; Karuppasamy D.; Adeogun A. I.; Babu B. R. Impregnation of zinc oxide modified clay over alginate beads: a novel material for the effective removal of congo red from wastewater. RSC Adv. 2017, 7, 5669–5678. 10.1039/C6RA26273B. [DOI] [Google Scholar]
- Adeogun A. I.; Idowu M. A.; Akiode K. O.; Ahmed S. A. Bioremediation of Cu (II) contaminated water by Saccharum officinarum: effect of oxalic acid modification on equilibrium, kinetic and thermodynamic parameters. Bioresour. Bioprocess. 2016, 3, 1–7. 10.1186/s40643-016-0085-9. [DOI] [Google Scholar]
- Garskaite E.; Gross K. A.; Yang S. W.; Yang T. C. K.; Yang J. C.; Kareiva A. Effect of processing conditions on the crystallinity and structure of carbonated calcium hydroxyapatite (CHAp). CrystEngComm 2014, 16, 3950–3959. 10.1039/c4ce00119b. [DOI] [Google Scholar]
- Mostafa N. Y. Characterization, thermal stability and sintering of hydroxyapatite powders prepared by different routes. Mater. Chem. Phys. 2005, 94, 333–341. 10.1016/j.matchemphys.2005.05.011. [DOI] [Google Scholar]
- Conz M. B.; Granjeiro J. M.; Soares G. D. Physicochemical characterization of six commercial hydroxyapatites for medical-dental applications as bone graft. J. Appl. Oral Sci. 2005, 13, 136–40. 10.1590/S1678-77572005000200008. [DOI] [PubMed] [Google Scholar]
- Pandi K.; Viswanathan N. In situ precipitation of nano-hydroxyapatite in gelatin polymatrix towards specific fluoride sorption. Int. J. Biol. Macromol. 2015, 74, 351–359. 10.1016/j.ijbiomac.2014.12.004. [DOI] [PubMed] [Google Scholar]
- Barka N.; Qouzal S.; Assabbane A.; Nounhan A.; Ichou Y. A. Removal of reactive yellow 84 from aqueous solutions by adsorption onto hydroxyapatite. J. Saudi Chem. Soc. 2011, 15, 263–267. 10.1016/j.jscs.2010.10.002. [DOI] [Google Scholar]
- Pathania D.; Sharma S.; Singh P. Removal of methylene blue by adsorption onto activated carbon developed from Ficus carica bast. Arabian J. Chem. 2017, 10, S1445–S1451. 10.1016/j.arabjc.2013.04.021. [DOI] [Google Scholar]
- Belmouden M.; Assabbane A.; Ichou Y. A. Adsorption characteristics of a phenoxy acetic acid herbicide on activated carbon. J. Environ. Monit. 2000, 2, 257–260. 10.1039/a909357e. [DOI] [PubMed] [Google Scholar]
- Al-Degs Y. S.; El-Barghouthi M. I.; El-Sheikh A. H.; Walker G. M. Effect of solution pH, ionic strength, and temperature on adsorption behavior of reactive dyes on activated carbon. Dyes Pigm. 2008, 77, 16–23. 10.1016/j.dyepig.2007.03.001. [DOI] [Google Scholar]
- Adeogun A. I.; Idowu M. A.; Akiode K. O.; Ahmed S. A. Bioremediation of Cu (II) contaminated water by Saccharum officinarum: effect of oxalic acid modification on equilibrium, kinetic and thermodynamic parameters. Bioresour. Bioprocess. 2016, 3, 1–7. 10.1186/s40643-016-0085-9. [DOI] [Google Scholar]
- Vahidhabanu S.; Karuppasamy D.; Adeogun A. I.; Babu B. R. Impregnation of zinc oxide modified clay over alginate beads: a novel material for the effective removal of congo red from wastewater. RSC Adv. 2017, 7, 5669–5678. 10.1039/C6RA26273B. [DOI] [Google Scholar]
- Khan M. A.; Alam M. M.; Naushad M.; Alothman Z. A.; Kumar M.; Ahamad T. Sol-gel assisted synthesis of porous nano-crystalline CoFe2O4 composite and its application in the removal of brilliant blue-R from aqueous phase: An ecofriendly and economical approach. Chem. Eng. J. 2015, 279, 416–424. 10.1016/j.cej.2015.05.042. [DOI] [Google Scholar]
- Hou H.; Zhou R.; Wu P.; Wu L. Removal of congo red dye from aqueous solution with hydroxyapatite/chitosan composite. Chem. Eng. J. 2012, 211–212, 336–342. 10.1016/j.cej.2012.09.100. [DOI] [Google Scholar]


