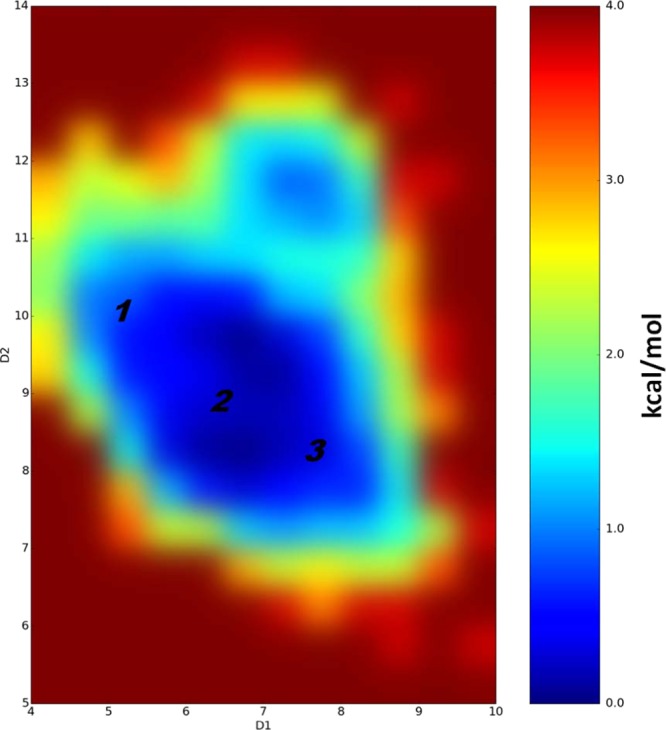
Figure 3.

Difference in free energies between detected conformations of PFHpA (in kcal/mol) determined by performed cMD simulations, which also represents their populations and probability of existence. D1 and D2 coordinates are the distances in angstrom between the carbon atom of the CF3 group (the end of ligand) and the Cα atoms of Phe282 (helix 3) and Tyr473 (helix 5), respectively. Note that the difference in free energies between detected PFHpA conformations is less than 1 kcal/mol.
