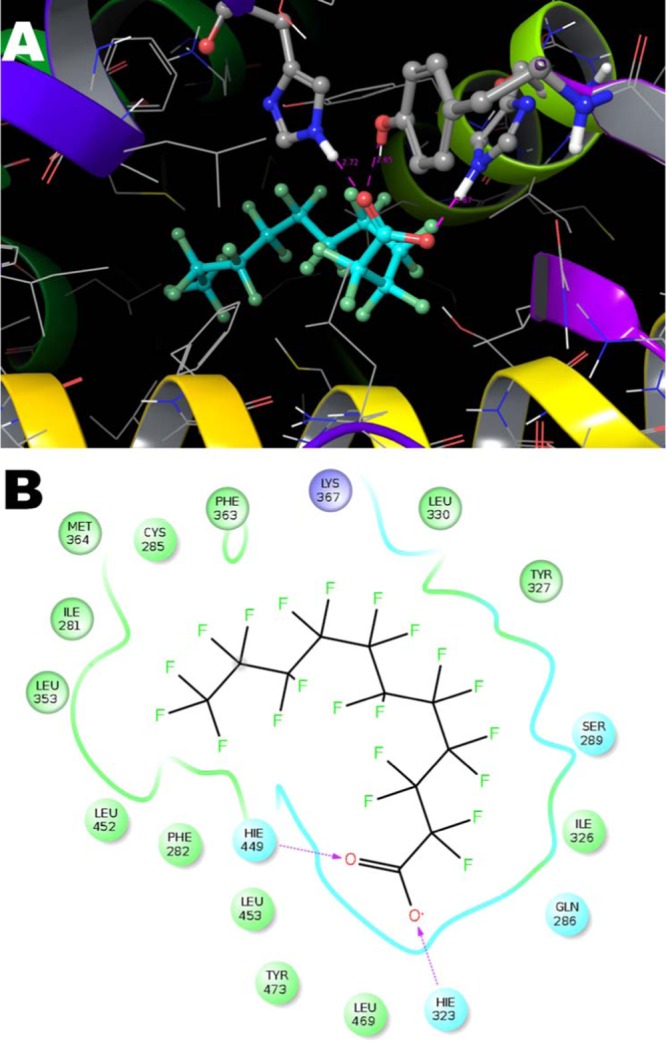
Figure 4.

Representation of detected PFuDA–receptor interactions in the most populated binding mode (binding mode 1) determined by a cMD simulation (second 130 ns run) illustrated by (A) three-dimensional (3D) and (B) 2D illustrations. The H-bonds are marked with dotted lines, and the blue and green spheres show the areas of electrostatic and hydrophobic interactions, respectively.
