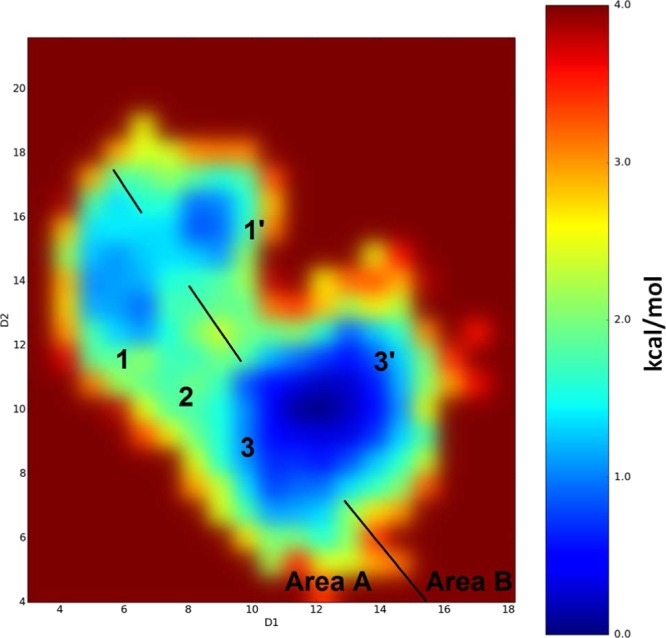
Figure 6.

Binding modes detected for the PFuDA ligand retrieved by aMD calculations and corresponding reweighted free energies (in kcal/mol) obtained by these simulations. D1 and D2 coordinates are the distances in angstrom between the carbon atom of the CF3 group (the end of ligand) and the Cα atoms of Phe282 (helix 3) and Tyr473 (helix 5), respectively. Note that some deviations between both D1 and D2 coordinates can be expected during the aMD simulations due to the larger variations in the receptor structure.
