Figure 3.

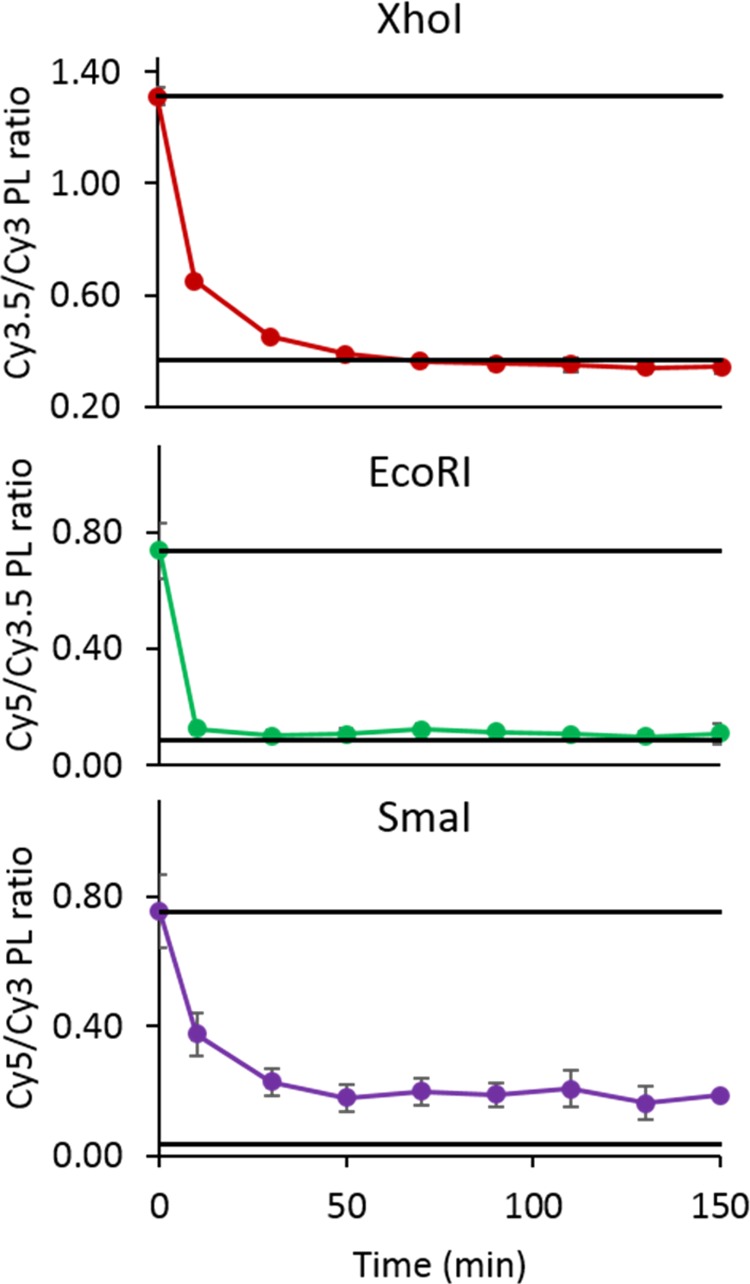
Assay of kinetic rate of cleavage for the partial structure cleavage. The top line in each plot represents the average of the positive control, and the bottom line is the average of the negative control.

Assay of kinetic rate of cleavage for the partial structure cleavage. The top line in each plot represents the average of the positive control, and the bottom line is the average of the negative control.