
Figure 3.
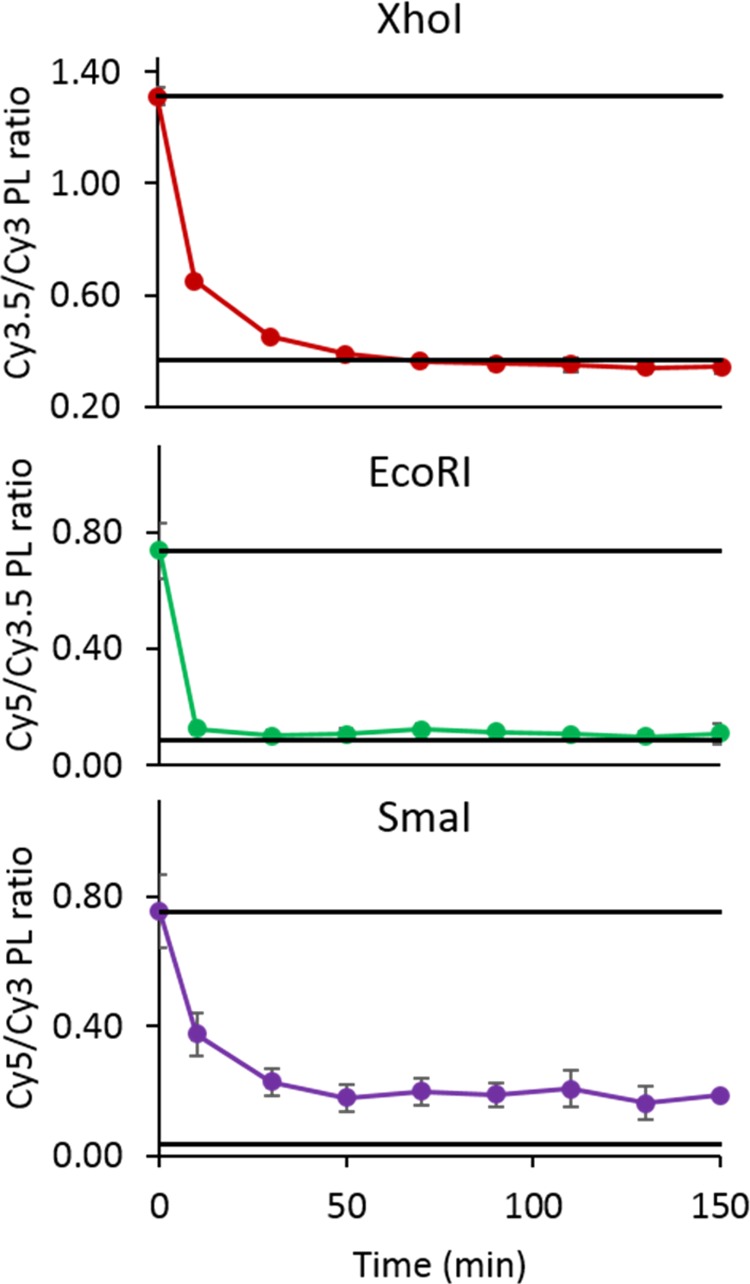
Assay of kinetic rate of cleavage for the partial structure cleavage. The top line in each plot represents the average of the positive control, and the bottom line is the average of the negative control.
Official websites use .gov
A
.gov website belongs to an official
government organization in the United States.
Secure .gov websites use HTTPS
A lock (
) or https:// means you've safely
connected to the .gov website. Share sensitive
information only on official, secure websites.
Assay of kinetic rate of cleavage for the partial structure cleavage. The top line in each plot represents the average of the positive control, and the bottom line is the average of the negative control.