Figure 3.

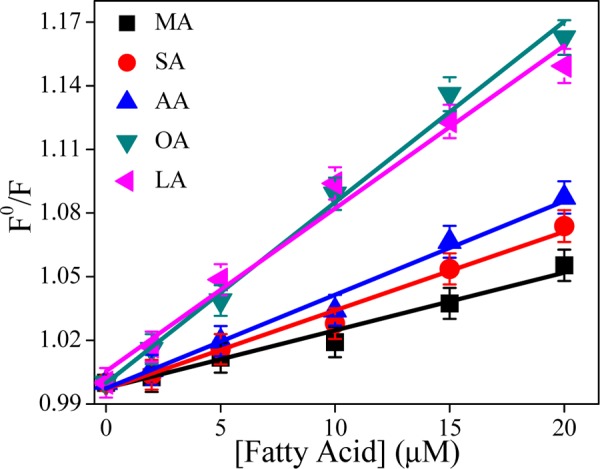
Plot of F0/F vs various fatty acids concentration (λex = 295 nm and λem = 351 nm), with the line showing the linear fit of data with an intercept of 1.

Plot of F0/F vs various fatty acids concentration (λex = 295 nm and λem = 351 nm), with the line showing the linear fit of data with an intercept of 1.