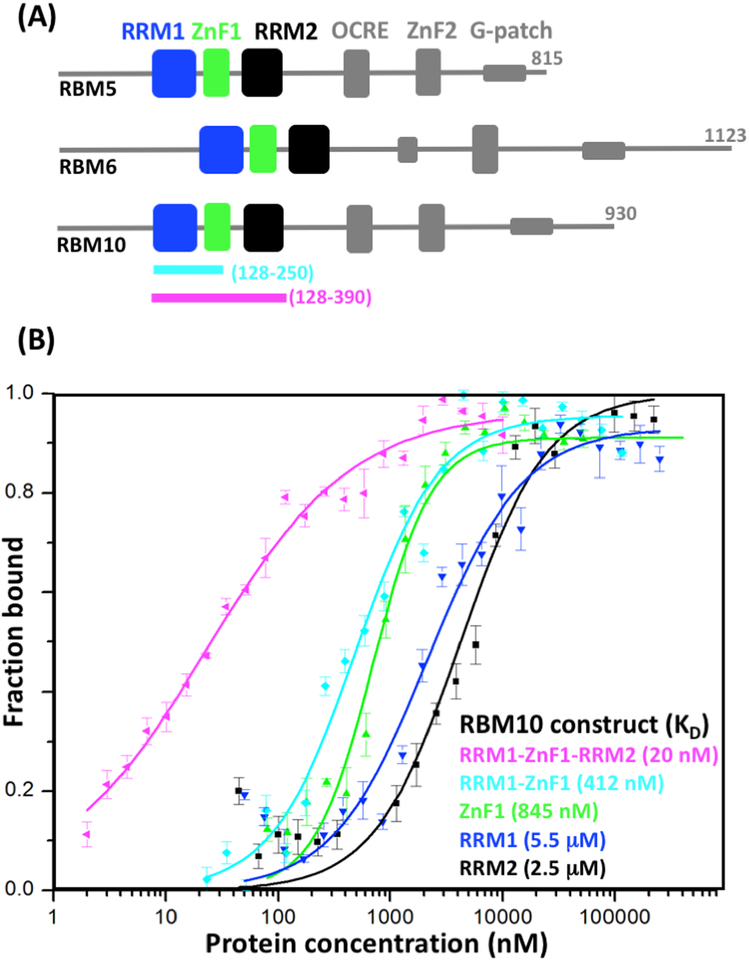
Figure 1. RBM5/6/10 domain architectures and recognition of exon 6 from Fas by RBM10 fragments.
(A) Schematic representation of the domain architectures of the three proteins. The three globular domains studied here are highlighted in color. At the bottom, the RRM1–ZnF1 and RRM1–ZnF1–RRM2 polypeptide fragments of RBM10 used for RNA binding assays are indicated by thick colored lines and indication of the chain ends. (B) Protein–RNA association curves with a 22-nucleotide RNA sequence from exon 6 of Fas, UAAUUGUUUGGGGUAAGUUCUU. The data were obtained using nitrocellulose binding assays with the RBM10 polypeptide fragments indicated in the figure. The same color code is used as in panel (A). Average values from three independent experiments are shown as geometric symbols, and the standard deviations are represented as vertical bars. KD values obtained with Hill-equation fitting are indicated in the lower right.

