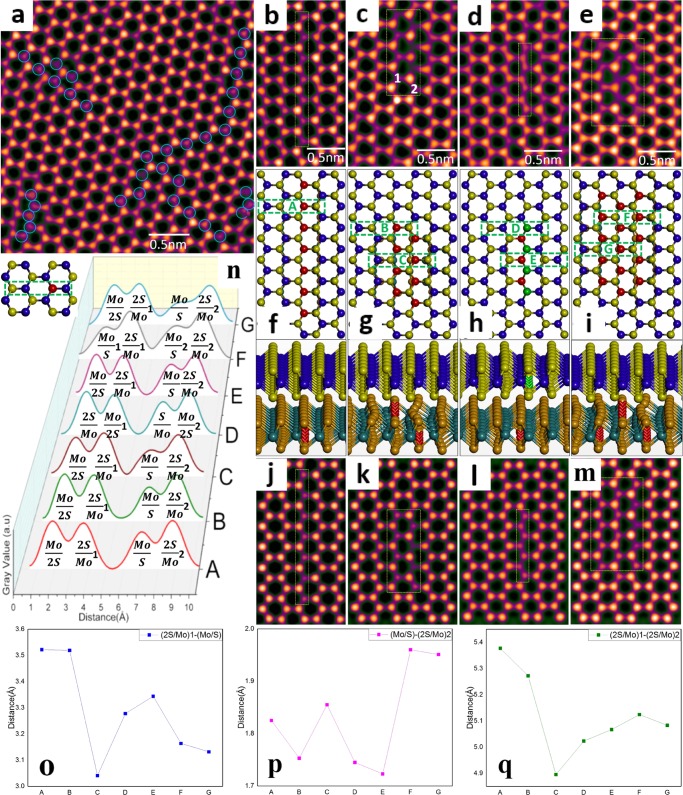
Figure 2.
(a) AC-TEM image showing the aggregation of S vacancies into extended line defects along a zigzag direction with different lengths and widths. HRTEM images showing (b) 1SVL, (c) type A-2SVL, (d) type B-2SVL, and (e) 3SVL, with the defective region in a yellow dashed rectangle, and (f–i) corresponding DFT-calculated atomic models. The S vacancies are marked in red in the bottom and green in the top layer (colored balls in the top view and colored crosses in the 3D view). (j–m) Multislice image simulations based on (f)–(i). (n) Boxed line profiles taken along green dashed rectangles marked as A–G. Scattered line graphs displaying the distance between (o) (2S/Mo)1 and (Mo/S), (p) (Mo/S) and (2S/Mo)2, and (q) (2S/Mo)1 and (2S/Mo)2.

