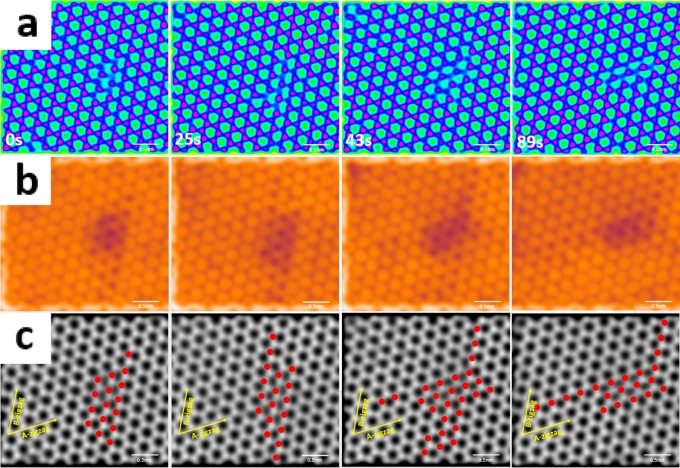
Figure 4.
(a) Series of processed AC-TEM images showing the evolution of S vacancies in 2H bilayer MoS2 over 89 s (a false color LUT is used to highlight vacancies). (b) S vacancies highlighted as darker spots using different false color LUTs. (c) Gray scale image showing vacancy migration and 3SVL rotation from the B-zigzag to the A-zigzag direction (S vacancies are marked as red dots).

