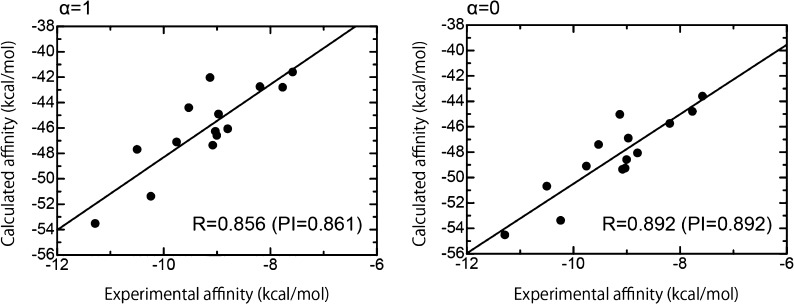
Figure 3.
Correlation between the experimental binding affinities and the calculated binding affinities using our scoring function for class A ligands. The abscissa and ordinate indicate the experimental and calculated binding affinities, respectively. The calculated binding affinities with a weighting factor of α = 1 (left-hand figure) and those with a weighting factor of α = 0 (right-hand figure) are shown.

