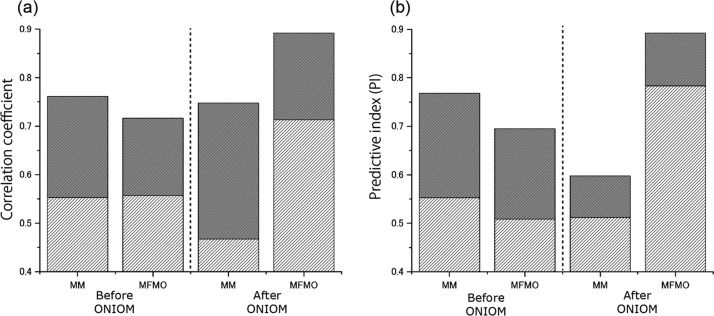
Figure 5.
Correlation coefficient and PI values for the experimental binding affinities and the calculated affinities before and after ONIOM geometry optimization for class A ligands. The correlation coefficient R values (a) and the PI values (b) on the MM- or MFMO-based energies are shown for structures of the tankyrase 2–ligand complexes before and after ONIOM geometry optimization. R (or PI) values between the binding energies (ΔEbindgas) and the experimental binding affinities are shown in light gray boxes. In addition, R (or PI) of the sum of the binding energies (ΔEbind) and the solvation energy on protein–ligand association (Gbindsolv) are shown by light and dark gray boxes. The entropic term is not included (i.e., the weighting factor α = 0).

