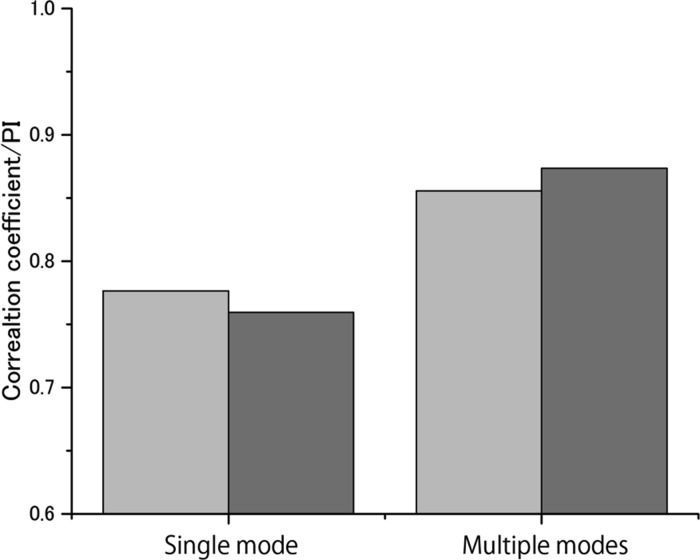
Figure 8.
Comparison of the correlation coefficients and PIs of the experimental binding affinities and the calculated binding affinities obtained using the single binding mode and multiple binding modes. The correlation coefficient and PI values are shown in light gray and dark gray boxes, respectively. The entropic term is not included (i.e., the weighting factor α = 0).

